Advancing clean energy as an independent power producer

Investors powering the energy transition

Greenbacker IPP Assets under management
CLEAN POWER GENERATED SINCE 2016
States, Provinces, Territories, & Districts

Deep market insight and operational strength enhance shareholder value
Access to deal flow
Tapping decades of transactional experience and industry relationships to source proprietary opportunities across the sustainable infrastructure asset class.
Capital markets expertise
Deep relationships with tax-equity and debt capital providers allow us to obtain attractive project financing in power markets across the U.S.
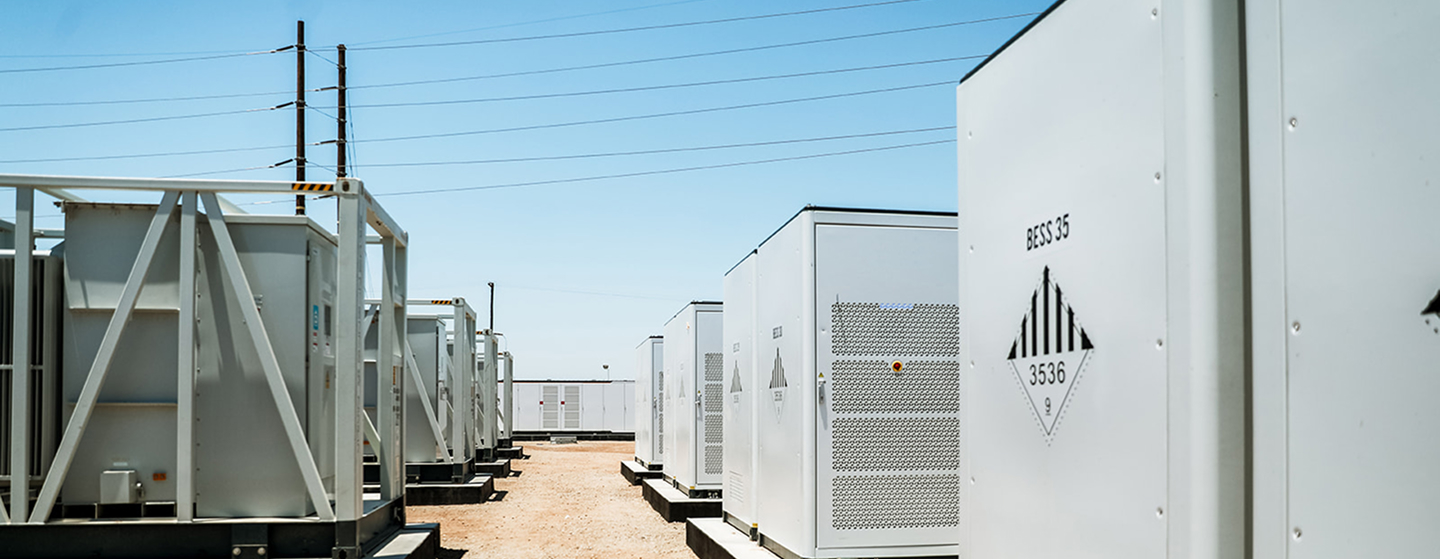
In-house fleet operations
Owner-operator mindset with a 20+ person technical operations staff that optimizes asset performance, prioritizes sustainability, and provides due diligence expertise to acquisitions team.
Active project management
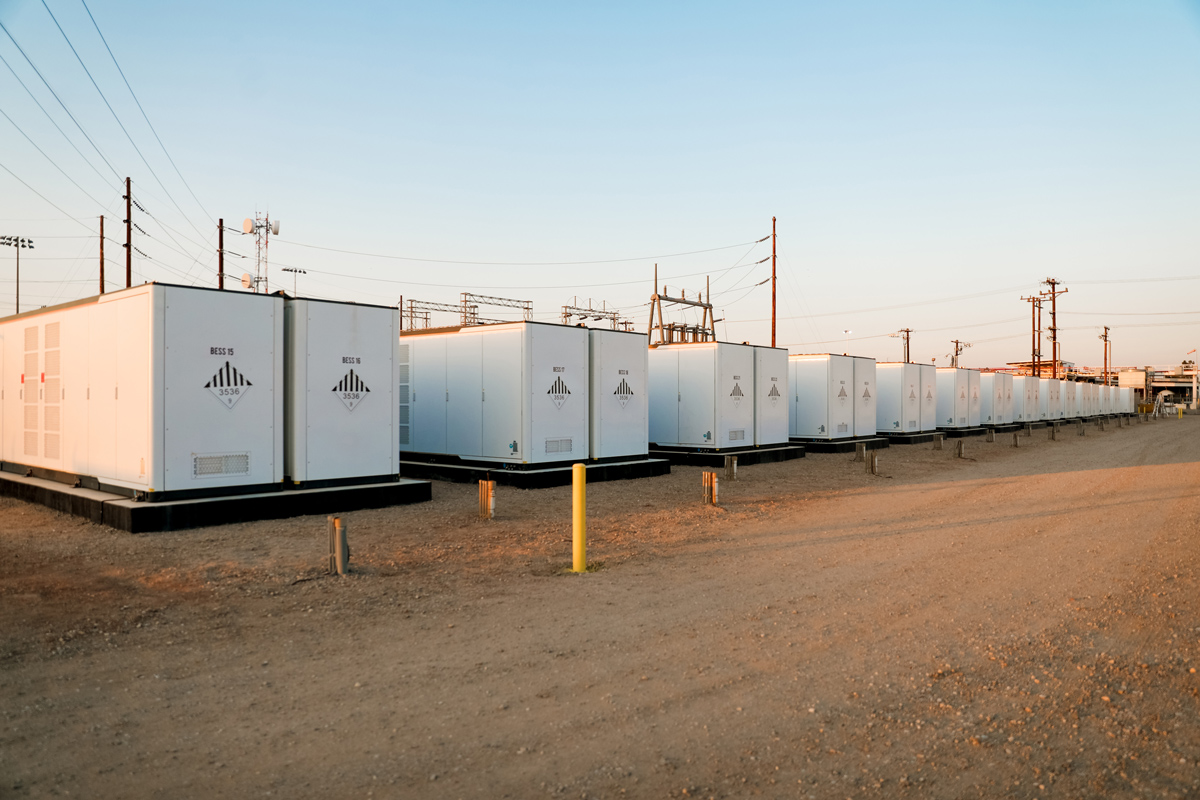
Ability to mine existing portfolios for organic opportunities to enhance value (e.g., wind and solar repowers, site expansion, adding onsite storage).
Longevity of contracted cashflow
Clean power-producing assets offer long-dated, predictable cash flow from high-credit-quality counterparties.
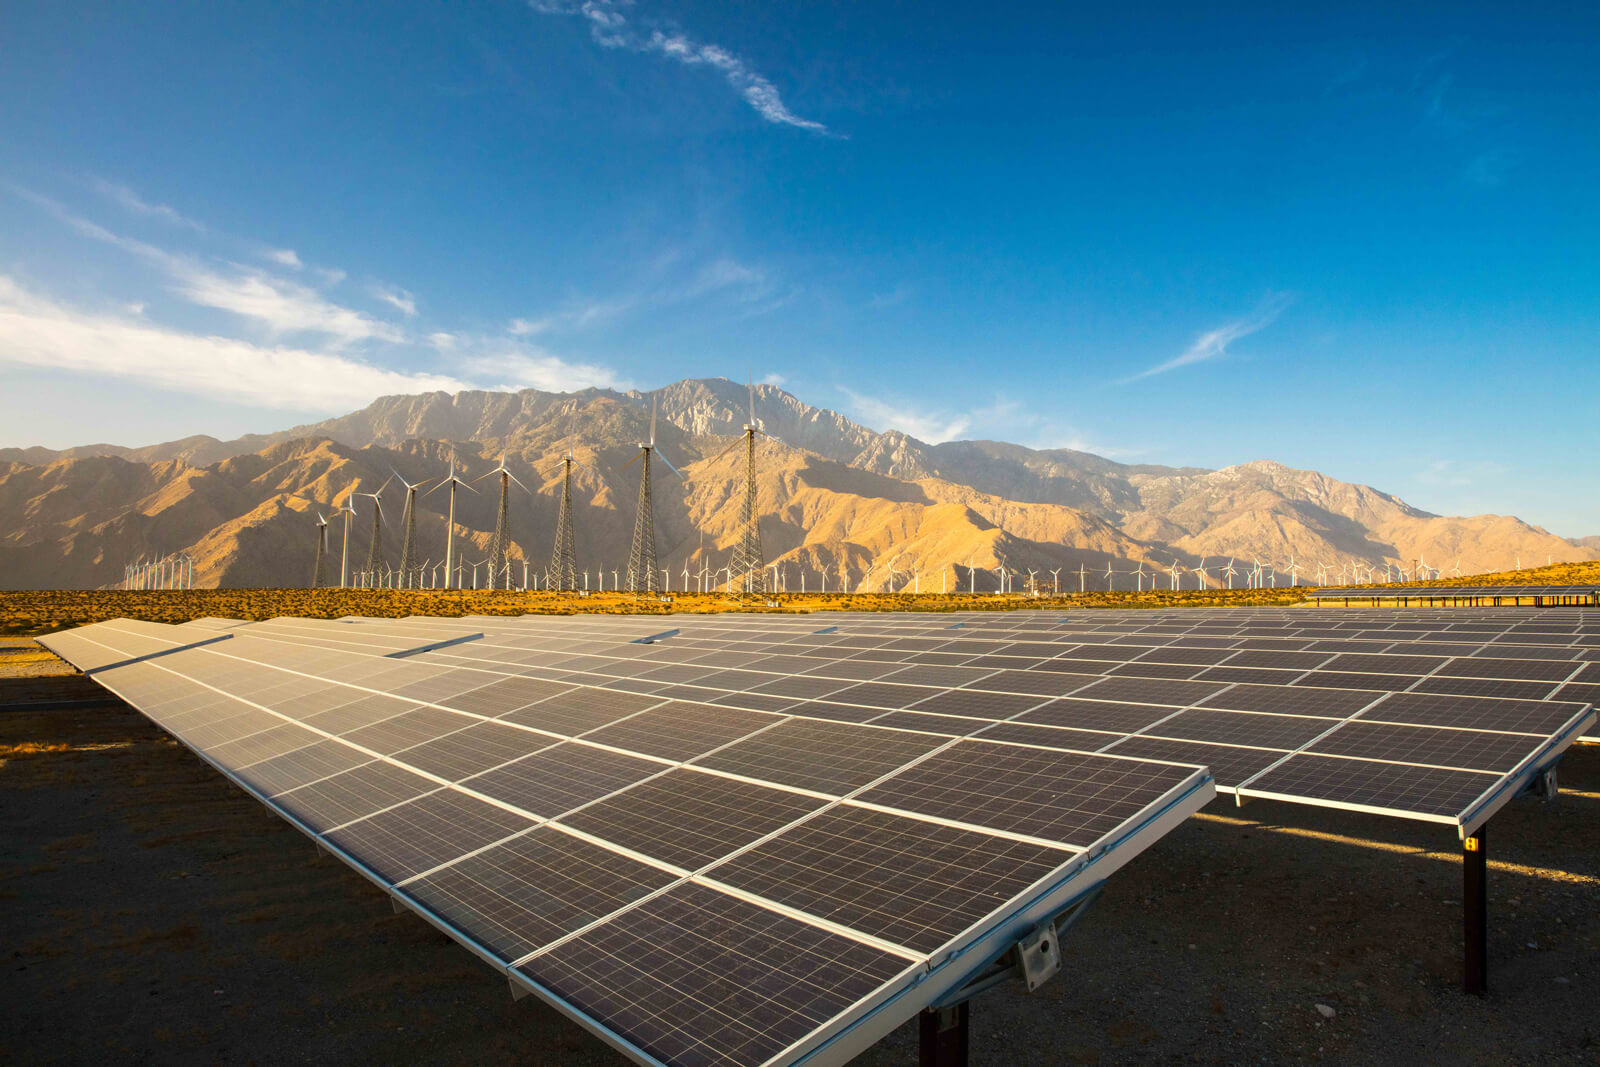
Strategic diversification
A fleet of clean energy projects that are well diversified across size, technology, counterparty, and geography.
Growth that powers tomorrow
Converting pre-operating projects into assets generating revenue
pre-operating /
under construction
2.7 GW
total clean power generating and storage capacity
1.3 GW
total operating capacity
25%
of project fleet is in construction, expected to be built by 2027
Long-term contracted cash flows1
161
total unique offtakers contracted to purchase power from GREC
<12%
no single offtaker accounts for more than 12% of our contracted revenue
17.2 Years2
average remaining PPA term of total portfolio
Capturing value across strategic areas of the country
220
renewable energy assets4 representing a total capacity of 2.7 GW
Diversified
across solar, wind, and storage
26
states, provinces, territories, & Washington, D.C.
Data as of March 31, 20265.
Diversification does not assure a profit or protect against loss in a declining market. Some figures may not add to stated totals due to rounding.
- References to cash flow reflect project-level cash flows and do not reflect investor-level cash flow or distributions.
- Weighted average remaining contract term refers to the power purchase agreements (“PPA”) of our total assets.
- Non-rated offtakers are unrated by credit rating agencies.
- Prior to 3Q20 the Company did not formally track total asset and capacity statistics for projects the Company had contracted to acquire but had not yet closed.
Performance across share classes
Class P-I Summary
Class P-A Summary
Class P-D Summary
Class P-T Summary
Class P-S Summary
*The publication of Greenbacker Renewable Energy Company’s quarterly net asset value and resulting price per share will be delayed beginning May 1, 2026, pending the completion of certain Board-level processes related to the aforementioned strategic review. We expect to provide an update on timing in the near term and appreciate your patience.
Past performance is not indicative of future results. Return information is unaudited and subject to change. All returns shown assume reinvestment of distributions and are net of all expenses.
- Monthly Share Value (MSV) based calculations involve significant professional judgment. The calculated value of our assets and liabilities may differ from our actual realizable value or future value, which would affect the MSV as well as any returns derived from MSV, and ultimately the value of your investment. See the Private Placement Memorandum (“PPM”) for additional details related to the calculation of MSV. On February 4, 2025, GREC filed an 8-K with the SEC regarding an update to the Company's net asset value update process, upon which MSV is based. For more information, please view the 8-K filing.
- Returns shown reflect the percentage change in the MSV per share from the beginning of the applicable period, plus the amount of any distribution per share declared in the period. All returns are unaudited, assume the reinvestment of distributions, and are net of all expenses including G&A expenses, management fees, performance participation fees, and share class specific fees, as applicable.
- Class P-I shares were launched in May 2016, no returns prior to launch.
- Class P-A shares were launched in May 2016, no returns prior to launch.
- Class P-A shares were converted into Class P-I shares during the quarter ended June 30, 2017 and were not offered for sale for the period through April 15, 2018. Effective April 16, 2018, Class P-A shares were again offered.
- Class P-D, P-T, and P-S shares launched in February 2021, no returns prior to launch.
- 2026 YTD figures are representative of the period of January 1, 2026 through May 31, 2026.
- Class P-A shares stopped being offered in March 2017 and started again in August 2018.
- On April 26, 2024, the Board of Directors of GREC approved the reduction to $0 of the daily distribution rates for each of the Class A, C, I, P-A, P-I, P-D, P-T, and P-S shares for the period from May 1, 2024 to December 31, 2025, or until such time as the Board affirmatively authorizes a change to these distribution rates.
Clean energy assets coast to coast
- Solar
- Solar + Storage
- Storage
- Wind


Resources to empower informed investing
Investor center
Contact our Transfer Agent at (833) 404-4104.
P.O. Box 219255
Kansas City, MO 64121
430 W 7th St, Ste 219255
Kansas City, MO 64105
Corporate governance
Our approach to energy transition investing
Connect with our dedicated team
Financial professionals: get started by clicking the link below to submit inquiries to our dedicated team.