Greenbacker delivers third quarter results
Company announces year-over-year increases in clean power operating capacity, production, and revenue, valuation adjustments to address interest rates and rising insurance costs
Key Takeaways
- Amid revenue and production growth, macro headwinds—including higher interest rates and insurance costs—put downward pressure on NAV.
- Operating fleet increased by over 300 MW, including Greenbacker’s largest project in South Dakota.
- Capacity expansion drove modest production increases; year-to-date generation enough to power 187,000 homes.
- Company’s revenue increased, driven by a 25% boost in solar PPA revenue; overall revenue growth was more modest due to repowers at three wind assets, which were turned off for equipment replacement to extend useful life and increase the revenue potential of the projects.
- Company estimates entire pre-operational fleet will enter operation, become revenue-generating no later than the end of 2027.
- Company closes on $75 million warehouse financing facility; potential to increase up to $250 million.
- Investment management segment raised over $52 million in capital; AUM increased to approximately $3.6 billion.
- Company’s investments support carbon abatement, water conservation, and green jobs.
New York, NY, November 14, 2023 — Greenbacker Renewable Energy Company LLC (“Greenbacker,” “GREC,” or the “Company”), an independent power producer and a leading climate-focused investment manager, has announced financial results1 for the third quarter of 2023, including year-over-year revenue increases and substantial year-over-year growth in operating capacity and clean energy generation.
Amid revenue and production growth, macro headwinds—including higher interest rates and insurance costs—put downward pressure on NAV
Although Greenbacker’s fleet of clean energy projects recorded higher revenue from renewable power sales in the quarter, macroeconomic trends—primarily rising interest rates and rising insurance premiums related to higher inflation and climate change—led the Company to increase the discount rates on its assets as well as make other adjustments, resulting in an approximate 6% decline in the Company’s net asset value (“NAV”) over the three-month period ended September 30, 2023.
Greenbacker has actively adjusted its discount rate as inflation and bond yields began to rapidly increase, resulting in a 7% increase in discount rate assumptions in the Company's valuation models since the beginning of 2022.
Notably, despite some of these macroeconomic headwinds, investor interest in the renewables space continues to reach new heights. Investment in the renewable energy asset class reached a record $358 billion in the first half of 2023,2 and global renewable capacity is expected to increase by 107 gigawatts (GW) in 2023—its largest annual increase ever.3
Operating fleet increased by over 300 MW, including Greenbacker’s largest project in South Dakota
The total clean power–production and storage capacity of Greenbacker’s operational project fleet increased by 305 MW, representing year-over-year growth of 25%, as the Company continued to move under-construction projects into commercial operation. As pre-construction assets become operational, they begin to generate and sell power under long-term contracts leading to incremental revenue gains.
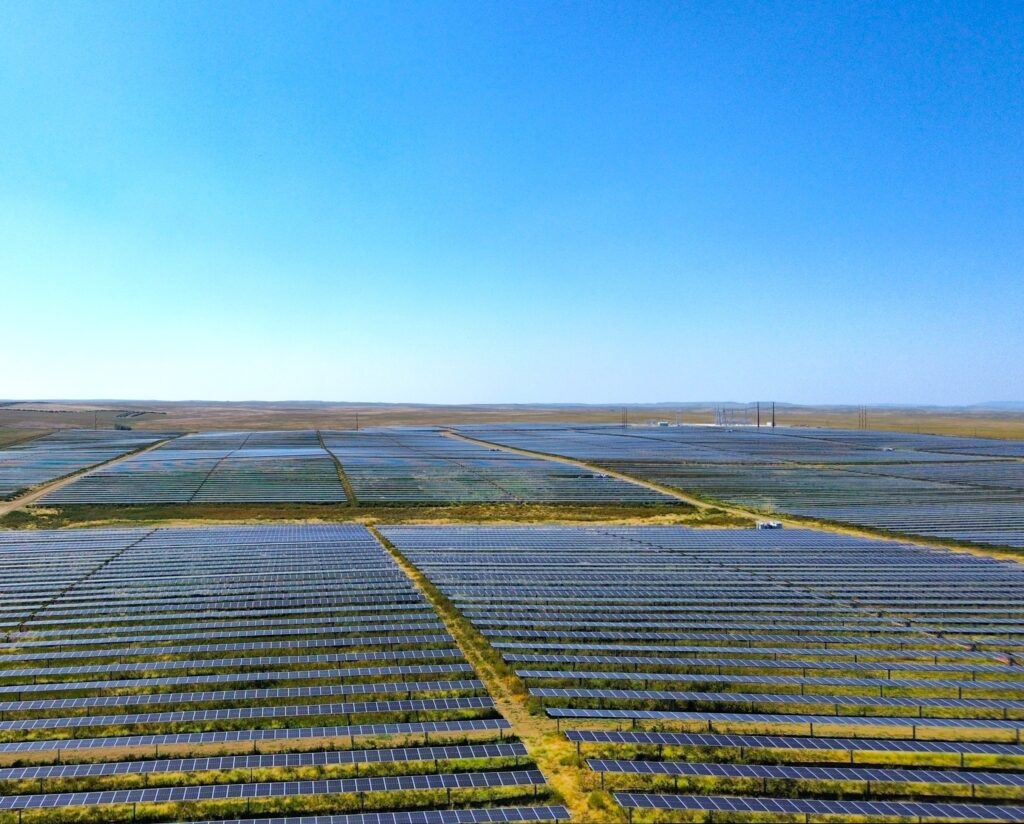
Of these 305 MW, one of the Company’s most exciting projects is the recently commissioned Fall River solar project. With a total energy generation capacity of 80 MWac / 99 MWdc, Fall River is both GREC’s largest clean energy asset in South Dakota and the third largest operating project in Greenbacker’s national fleet. The Company also powered on its recently announced Montezuma solar project in Colorado, as well as several smaller solar assets in Ohio, Nevada, and Utah.
Greenbacker’s largest solar power project in South Dakota
As of September 30, 2023, Greenbacker’s clean energy fleet totaled 445 assets across North America,4 a year-over-year decrease of 11 projects. These 11 projects in Greenbacker's pre-operational pipeline represented projects to which little to no capital had been committed and that no longer optimally aligned with the Company's investment strategy for various macro reasons. Greenbacker incurred no financial penalties in deciding to no longer pursue these projects.
Capacity expansion drives production increases; year-to-date generation enough to power 187,000 homes
With this increased operating capacity, Greenbacker’s clean power production continued its multi-year record of growth. During the quarter, the Company’s fleet generated 675,000 megawatt-hours (MWh) of total clean power, a year-over-year increase of 6%. This growth was driven by a 25% increase in energy produced by GREC’s solar assets and occurred even as the Company voluntarily took three wind assets out of operation in order to upgrade their equipment and extend the projects’ useful life.
In the year to date, the fleet produced over 2.0 million MWh of clean energy—enough to power approximately 186,871 US households annually,5 and representing a 12% increase from the same period in 2022.
The table below summarizes the year-over-year capacity and production increases within Greenbacker’s portfolio.
GREC Portfolio Metrics*September 30, 2023September 30, 2022YoY Increase (total)YoY increase (%)Power-production capacity of operating fleet at end of period1.5 GW1.2 GW305 MW25%Power-generating capacity of pre-operational fleet at end of period1.8 GW1.8 GW18 MW1%Total power-generating capacity of fleet at end of period3.3 GW3.0 GW337 MW11%YTD total energy produced at end of period (MWh)2,016,5231,797,942218,58112%*GW figures are rounded to nearest tenth. Some figures may not add to stated totals, due to rounding.
Charles Wheeler, CEO of Greenbacker, said:
“We're converting our pre-operational fleet into income-producing assets at an incredible pace, while at the same time identifying attractive opportunities to augment our existing operating fleet. This year alone, Greenbacker has brought online two of its three largest operating projects, increasing the amount of clean power we generate for consumers and driving significant year-over-year revenue increases.”
Company’s revenue increased, driven by a 25% boost in solar PPA revenue; overall revenue growth was more modest due to repowers at three wind assets, which were turned off for equipment replacement to extend useful life and increase the revenue potential of the projects
Greenbacker also announced third quarter financial information for the Company, which includes its Independent Power Producer (“IPP”) and Investment Management (“IM”) business segments, the latter of which includes the Company’s investment management platform, Greenbacker Capital Management (“GCM”).
The Company’s operating solar fleet generated $24.1 million of revenue under its Power Purchase Agreements (“PPA revenue”), a 25% year-over-year increase that amounted to an additional $4.8 million revenue from the Company’s solar PPAs. In total, the fleet’s 314 assets, representing 1,098 MW of capacity, produced approximately 484,000 MWh of solar power in the quarter.
In order to increase production, extend the life of certain assets, and increase the length of its contracts to sell electricity, the Company strategically took three of its operating wind assets offline during portions of the quarter, to repower or retrofit the projects with newer components. Along with extending assets’ useful life and increasing generation capacity, these project upgrades should also benefit from the 30% investment tax credit (“ITC”) extended by the Inflation Reduction Act—highlighting the significant tailwinds the legislation is providing for the industry and the Company.
With these assets offline, GREC’s operating wind fleet, which included 16 operating projects comprising 386 MW of capacity, generated $9.8 million of PPA revenue from approximately 174,000 MWh of production. This represented a 29% (or $4.0 million) year-over-year decrease in wind PPA revenue.
Although less wind PPA revenue in the quarter also weighed on the Company’s operational results, once repowers and retrofits are completed these projects will return to operation, generating wind energy with more efficient equipment and contributing to future revenue.
GREC Operating Fleet*Third Quarter 2023Third Quarter 2022YoY Increase (total)YoY increase (%)Clean power produced by solar assets (MWh)483,643361,551122,09234%PPA revenue generated by solar assets (millions)$24.1$19.3$4.825%Clean power produced by wind assets (MWh)173,682250,074(76,392)(31)%PPA revenue generated by wind assets (millions)$9.8$13.9$(4.0)(29)%Total clean power generated† (MWh)674,631636,15038,4816%Total PPA revenue generated (millions)$35.8$35.1$0.62%*Some figures may not add to stated totals, due to rounding.
†Includes power generated by biomass facility.
Greenbacker generated total operating revenue of $49.2 million in the quarter, which represents a 7% year-over-year increase, primarily due to energy revenue within the IPP segment. Energy revenue totaled $43.7 million and included $35.8 million from our long-term PPAs, representing year-over-year increases of 5% and 2%, respectively.
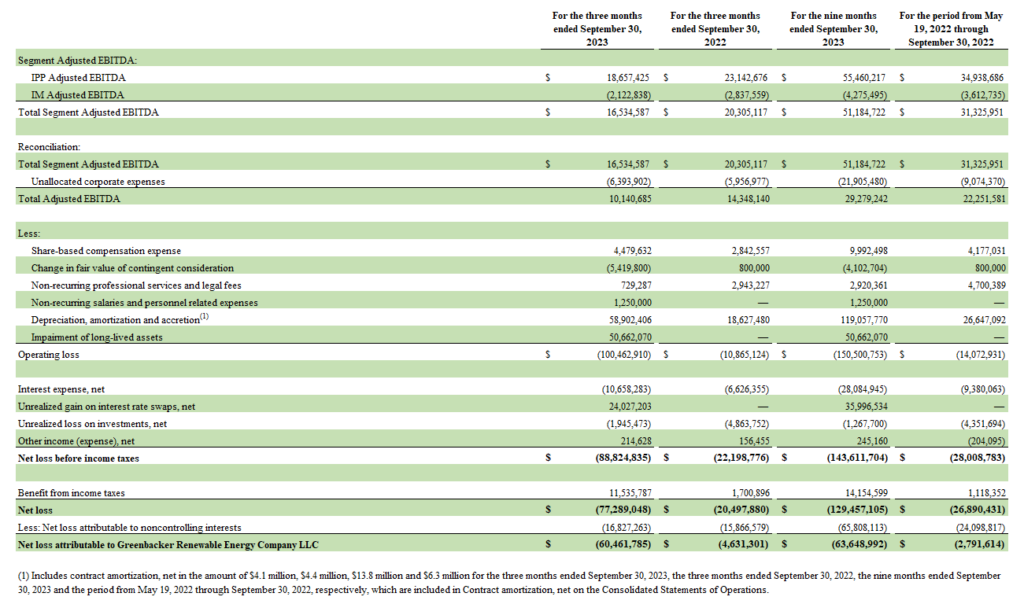
Adjusted EBITDA was $10.1 million for the quarter, largely driven by Adjusted EBITDA within the IPP segment of $18.7 million. Direct operating costs associated with capital raise efforts for certain of IM’s managed funds in their early stages and corporate expenses offset IPP results.
Funds From Operations (“FFO”) was $(2.4) million for the period and represents the $10.1 million of Adjusted EBITDA less cash interest expense and distributions to our tax equity investors.
The net loss attributable to Greenbacker was approximately $60.5 million, driven by non-cash depreciation, amortization, and impairment charges recorded during the period. This includes accelerated depreciation related to the repower and retrofit, and an impairment charge related to a single underperforming renewable energy project.
For the three months ended September 30, 2023In millions (unaudited)Select Financial Information Total Revenue$ 45.1Total operating revenue*$ 49.2Net loss attributable to Greenbacker$ (60.5) Adjusted EBITDA†$ 10.1FFO†$ (2.4)NOTE: See the Company’s quarterly 10-Q filed with the SEC for additional financial information and important related disclosures.
*Total operating revenue excludes non-cash contract amortization, net.
†See “Non-GAAP Financial Measures” for additional discussion.
Entire pre-operational fleet to enter operation, become revenue-generating by end of 2027
In addition to the repower and equipment replacement initiatives in Greenbacker’s operating fleet, the Company also intends to complete construction on its entire pre-operational fleet and place it into service on a rolling basis, with the completion of those projects making them operational no later than the fourth quarter of 2027.
Greenbacker expects that these additional operational assets will generate extensive growth in revenues and EBITDA, as the Company begins benefiting from the additional contracted cash flows from an increasing number of operating projects. Each of Greenbacker’s pre-operational projects have long-term contracts to sell power to credit-worthy counterparties.
The table below illustrates Greenbacker’s estimated timeline for putting its current pre-operational pipeline into service.
Operating Fleet (MW)Pre-Operating Fleet (MW)Total (MW)3Q 20231,5041,8443,3483Q 20241,8011,5463,3483Q 20252,1961,1513,3483Q 20262,5767713,3484Q 20273,348--3,348*Capacity figures are rounded to nearest MW. Some figures may not add to stated totals, due to rounding.
Company closes on $75 million warehouse financing facility; potential to increase up to $250 million
During the quarter, Greenbacker secured a new $75 million warehouse financing facility to support the construction and operation of its solar, solar-plus-storage, and standalone energy storage portfolios. The three-year revolving credit facility provides both considerable borrowing capacity and enhanced liquidity for the Company’s sustainability investments.
The facility is structured such that it can extend revolving loans for eligible projects in an aggregate amount up to $75 million, which may be increased to an aggregate amount of up to $250 million. It also includes a sublimit of up to $50 million for issuances of letters of credit.
Wells Fargo served as sole lead arranger, bookrunner, sustainability structuring agent, and administrative agent for the facility, and Wilmington Trust, National Association served as the collateral agent.
Investment management segment raised over $52 million in capital; AUM increased to approximately $3.6 billion
During the third quarter, Greenbacker’s IM business segment continued to receive substantial additional capital from retail and institutional investors. Overall, the Company raised $52.7 million of new equity capital, upon which GCM is entitled to collect management and performance fees. At the end of the period, the IM segment’s year-to-date capital raise totaled $197.4 million, and Greenbacker’s AUM6 had increased to approximately $3.6 billion.
As of September 30, 2023, GCM served as the investment manager to four energy transition-focused funds.
The fees generated from these funds drove $2.8 million in revenue during the third quarter of 2023, mainly driven by AUM growth in Greenbacker Renewable Energy Company II and Greenbacker Development Opportunities Fund II, representing a considerable increase relative to fee revenue of $200,000 in the same period in 2022.
Company’s investments support carbon abatement, water conservation, and green jobs
In addition to providing investors with opportunities to put their capital to work in the energy transition, Greenbacker’s investment activities continued to deliver on ESG and impact metrics in the quarter.
As of September 30, 2023, the Company’s clean energy assets had cumulatively produced nearly 8.2 million MWh of clean power since January 2016, abating approximately 5.8 million metric tons of carbon.7
The Company’s clean energy projects have saved more than 5.6 billion gallons of water,8 compared to the amount of water needed to produce the same amount of power by burning coal, and its business activities will sustain over 6,400 green jobs.9
Additional information regarding the Company’s impact can also be found in Greenbacker’s impact report.
Forward-Looking Statements
This press release contains forward-looking statements within the meaning of the federal securities laws. Forward-looking statements are not guarantees of future performance and involve known and unknown risks, uncertainties and other factors that may cause the actual results to differ materially from those anticipated at the time the forward-looking statements are made. Although Greenbacker believes the expectations reflected in such forward-looking statements are based upon reasonable assumptions, it can give no assurance that the expectations will be attained or that any deviation will not be material. Greenbacker undertakes no obligation to update any forward-looking statement contained herein to conform to actual results or changes in its expectations.
Non-GAAP Financial Measures
In addition to evaluating the Company’s performance on a U.S. GAAP basis, the Company now utilizes certain non-GAAP financial measures to analyze the operating performance of our segments as well as our consolidated business. Each of these measures should not be considered in isolation from or as superior to or as a substitute for other financial measures determined in accordance with U.S. GAAP, such as net income (loss) or operating income (loss). The Company uses these non-GAAP financial measures to supplement its U.S. GAAP results in order to provide a more complete understanding of the factors and trends affecting its operations.
Adjusted EBITDA
Adjusted EBITDA is a non-GAAP financial measure that the Company uses as a performance measure, as well as for internal planning purposes. We believe that Adjusted EBITDA is useful to management and investors in providing a measure of core financial performance adjusted to allow for comparisons of results of operations across reporting periods on a consistent basis, as it includes adjustments relating to items that are not indicative on the ongoing operating performance of the business.
Adjusted EBITDA is a performance measure used by management that is not calculated in accordance with U.S. GAAP. Adjusted EBITDA should not be considered in isolation from or as superior to or as a substitute for net income (loss), operating income (loss) or any other measure of financial performance calculated in accordance with U.S. GAAP. Additionally, our calculation of Adjusted EBITDA may not be comparable to similarly titled measures reported by other companies.
Funds From Operations
FFO is a non-GAAP financial measure that the Company uses as a performance measure to analyze net earnings from operations without the effects of certain non-recurring items that are not indicative of the ongoing operating performance of the business. FFO is calculated using Adjusted EBITDA less the impact of interest expense (excluding the non-cash component) and distributions to tax equity investors under the financing facilities associated with our IPP segment.
The Company believes that the analysis and presentation of FFO will enhance our investor’s understanding of the ongoing performance of our operating business. The Company will consider FFO, in addition to other GAAP and non-GAAP measures, in assessing operating performance and as a proxy for growth in distribution coverage over the long term.
FFO should not be considered in isolation from or as a superior to or as a substitute for net income (loss), operating income (loss) or any other measure of financial performance calculated in accordance with U.S. GAAP.
General Disclosure
This information has been prepared solely for informational purposes and is not an offer to buy or sell or a solicitation of an offer to buy or sell any security, or to participate in any trading or investment strategy. The information presented herein may involve Greenbacker’s views, estimates, assumptions, facts, and information from other sources that are believed to be accurate and reliable and are, as of the date this information is presented, subject to change without notice.
Non-GAAP Reconciliations
Adjusted EBITDA
The following table reconciles Net loss attributable to Greenbacker Renewable Energy Company LLC to Adjusted EBITDA:
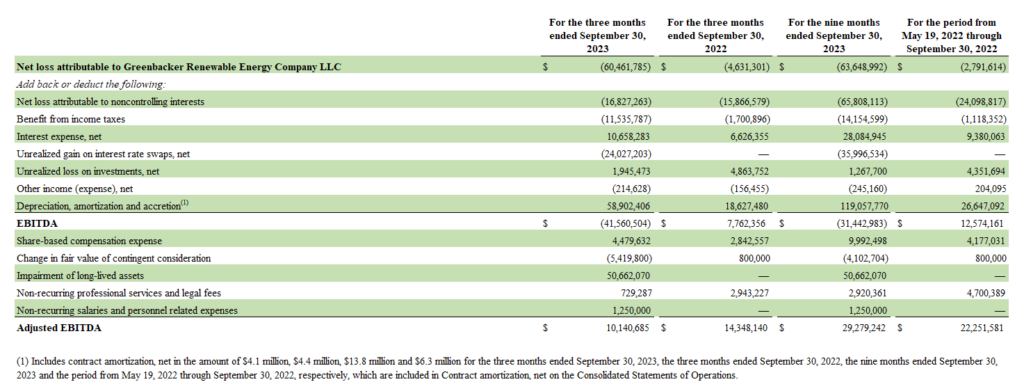
The Company defines Adjusted EBITDA as net income (loss) before: (i) interest expense; (ii) income taxes; (iii) depreciation expense; (iv) amortization expense (including contract amortization); (v) accretion; (vi) impairment of long-lived assets; (vii) amounts attributable to our redeemable and non-redeemable noncontrolling interests; (viii) unrealized gains and losses on financial instruments; (ix) other income (loss); and (x) foreign currency gain (loss). Additionally, the Company further adjusts for the following items described below:
- Share-based compensation is excluded from Adjusted EBITDA as it is different from other forms of compensation, as it is a non-cash expense and is highly variable. For example, a cash salary generally has a fixed and unvarying cash cost. In contrast, the expense associated with an equity-based award is generally unrelated to the amount of cash ultimately received by the employee, and the cost to the Company is based on a share-based compensation valuation methodology and underlying assumptions that may vary over time.
- The change in fair value of contingent consideration, which is related to Greenbacker’s acquisition of GCM and certain other affiliated companies, is excluded from Adjusted EBITDA, if any such change occurs during the period. The non-cash, mark-to-market adjustments are based on the expected achievement of revenue targets that are difficult to forecast and can be variable, making comparisons across historical and future quarters difficult to evaluate.
- Other costs that are not consistently occurring, not reflective of expected future operating expense, and provide no insight into the fundamentals of current or past operations of our business are excluded from Adjusted EBITDA. This includes costs such as professional services and legal fees.
The Company uses Segment Adjusted EBITDA to evaluate the financial performance of and allocate resources among our operating segments. Segment Adjusted EBITDA is determined for our segments consistent with the adjustments noted above but further excludes unallocated corporate expenses as these items are centrally controlled and are not directly attributable to any reportable segment.
The following table reconciles total Segment Adjusted EBITDA to Net loss attributable to Greenbacker Renewable Energy Company LLC:
Funds From Operations
The following table reconciles Net loss attributable to Greenbacker Renewable Energy Company LLC to Adjusted EBITDA and then to FFO:
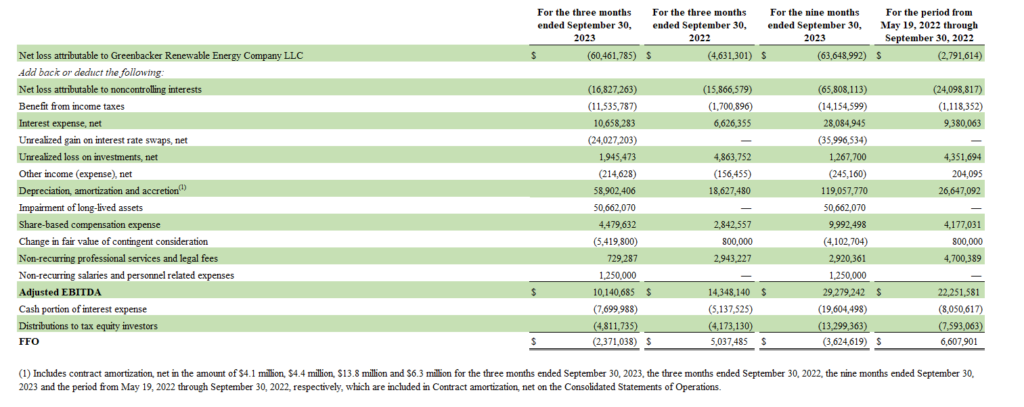
FFO is a non-GAAP financial measure that the Company uses as a performance measure to analyze net earnings from operations without the effects of certain non-recurring items that are not indicative of the ongoing performance of the business.
FFO is calculated using Adjusted EBITDA less the impact of interest expense (excluding the non-cash component) and distributions to tax equity investors under the financing facilities associated with our IPP segment.
About Greenbacker Renewable Energy Company
Greenbacker Renewable Energy Company LLC is a publicly reporting, non-traded limited liability sustainable infrastructure company that both acquires and manages income-producing renewable energy and other energy-related businesses, including solar and wind farms, and provides investment management services to other renewable energy investment vehicles. We seek to acquire and operate high-quality projects that sell clean power under long-term contracts to high-creditworthy counterparties such as utilities, municipalities, and corporations. We are long-term owner-operators, who strive to be good stewards of the land and responsible members of the communities in which we operate. Greenbacker conducts its investment management business through its wholly owned subsidiary, Greenbacker Capital Management, LLC, an SEC-registered investment adviser. We believe our focus on power production and asset management creates value that we can then pass on to our shareholders—while facilitating the transition toward a clean energy future. For more information, please visit https://greenbackercapital.com.
Greenbacker media contact
Chris Larson
Media Communications
646.569.9532
c.larson@greenbackercapital.com
1 Past performance is not indicative of future results.
2 Renewable Energy Investment Hits Record-Breaking $358 Billion in 1H 2023 | BloombergNEF, Meredith Annex, August 21, 2023.
3 Executive summary – Renewable Energy Market Update, International Energy Agency, June 2023.
4 Total assets and megawatts statistics include those projects where the Company has contracted for the acquisition of the project pursuant to a Membership Interest Purchase Agreement (“MIPA”).
5 Frequently Asked Questions (FAQs) - U.S. Energy Information Administration (EIA)
6 Total AUM includes GREC and GCM’s managed funds. AUM represents the underlying fair value of investments, determined generally in accordance with ASC 820, cash and cash equivalents and project level debt. These figures are unaudited and subject to change.
7 When compared with a similar amount of power generation from fossil fuels. Carbon abatement is calculated using the EPA Greenhouse Gas Equivalencies Calculator which uses the Avoided Emissions and generation Tool (AVERT) US national weighted average CO2 marginal emission rate to convert reductions of kilowatt-hours into avoided units of carbon dioxide emissions.
8 Gallons of water saved are calculated based on Operational water consumption and withdrawal factors for electricity generating technologies: a review of existing literature – IOPscience, J Macknick et al 2012 Environ. Res. Lett. 7 045802.
9 Green jobs are calculated from the International Renewable Energy Agency's measurement that one megawatt of renewable power supports approximately 4 jobs. Data is as of September 30, 2023.