Greenbacker delivers second quarter results
Company announces quarterly financial results and a 508 MW year-over-year increase in fleet capacity
Key Takeaways
- Fleet added more than 500 MW of additional clean energy capacity across over 30 new assets.
- Operating fleet continued to grow, including bringing online one of GREC’s largest clean energy projects.
- Fleet expansion drove substantial increase in clean power production.
- Operating revenue of nearly $51 million in the quarter, driven by strong energy revenue.
- Over $86 million capital raised in investment vehicles managed by GCM; AUM increased to approximately $3.3 billion.
- Company’s investments support carbon abatement, water conservation, and green jobs.
New York, NY, August 15, 2023 — Greenbacker Renewable Energy Company LLC (“Greenbacker,” “GREC,” or the “Company”), an independent power producer and a leading climate-focused investment manager, has announced financial results1 for the second quarter of 2023, as well as substantial continued year-over-year fleet expansion.
Fleet added more than 500 MW of additional clean energy capacity across over 30 new assets
Greenbacker’s clean energy fleet grew by 32 assets, on a year-over-year basis, increasing the Company’s total project count to 457 (including both operating and pre-operational assets).2
This expansion represented over half a gigawatt (GW)—nearly 508 MW—of additional total clean energy–generating and storage capacity across the country. As of June 30, 2023, Greenbacker was conducting business in 32 states, Canada, Puerto Rico, and Washington, DC.
Operating fleet continued to grow, including bringing online one of GREC’s largest clean energy projects
The power-production capacity of Greenbacker’s operational fleet of clean energy projects increased by 168 MW, representing year-over-year growth of 14%, as the Company moved under-construction projects into commercial operation.
This expansion included bringing online: the 80 MWac / 104 MWdc MTSun, one of GREC’s largest solar projects; the final project in Greenbacker’s first clean energy portfolio in Washington state; and one of several Greenbacker solar assets at the Denver International airport.
Greenbacker solar energy project at Denver airport

Greenbacker’s clean energy fleet includes half a dozen solar energy assets located at the Denver International Airport—including the 6.1 MWdc DIA 8 solar project (pictured here).
Fleet expansion drove substantial increase in clean power production
With this capacity growth, the Company’s fleet generated over 765,000 MWh of total clean power during the quarter, a 17% year-over-year increase that highlighted the Company’s continued production growth.
In the first half of 2023, Greenbacker’s fleet produced over 1.3 GW of clean energy, marking a 16% increase from the same period in 2022.
The table below summarizes the year-over-year expansion of Greenbacker’s portfolio.
GREC Portfolio Metrics*June 30, 2023June 30, 2022YoY Increase (total)YoY increase (%)Power-production capacity of operating fleet at end of period1.4 GW1.2 GW168 MW14%Power-generating capacity of pre-operational fleet at end of period2.0 GW1.6 GW340 MW21%Total power-generating capacity of fleet at end of period3.4 GW2.9 GW508 MW18%YTD total energy produced at end of period (MWh)1,341,8871,161,792180,09516%Total number of fleet assets at end of period457425328%*GW figures are rounded to nearest tenth. Some figures may not add to stated totals, due to rounding.
Charles Wheeler, CEO of Greenbacker, said:
“We believe that clean energy is essential for mitigating the climate crisis and powering a sustainable future. Greenbacker’s fleet continues to bring online projects of all sizes across the country—including MTSun, our second largest operational asset to date—and we continue to generate more clean energy for communities and create greater value for our shareholders.”
Operating revenue of nearly $51 million in the quarter, driven by strong energy revenue
Greenbacker has also announced discrete second quarter financial information for its Independent Power Producer (“IPP”) and Investment Management (“IM”) business segments, the latter of which includes Greenbacker Capital Management (“GCM”) and its investment management platform.
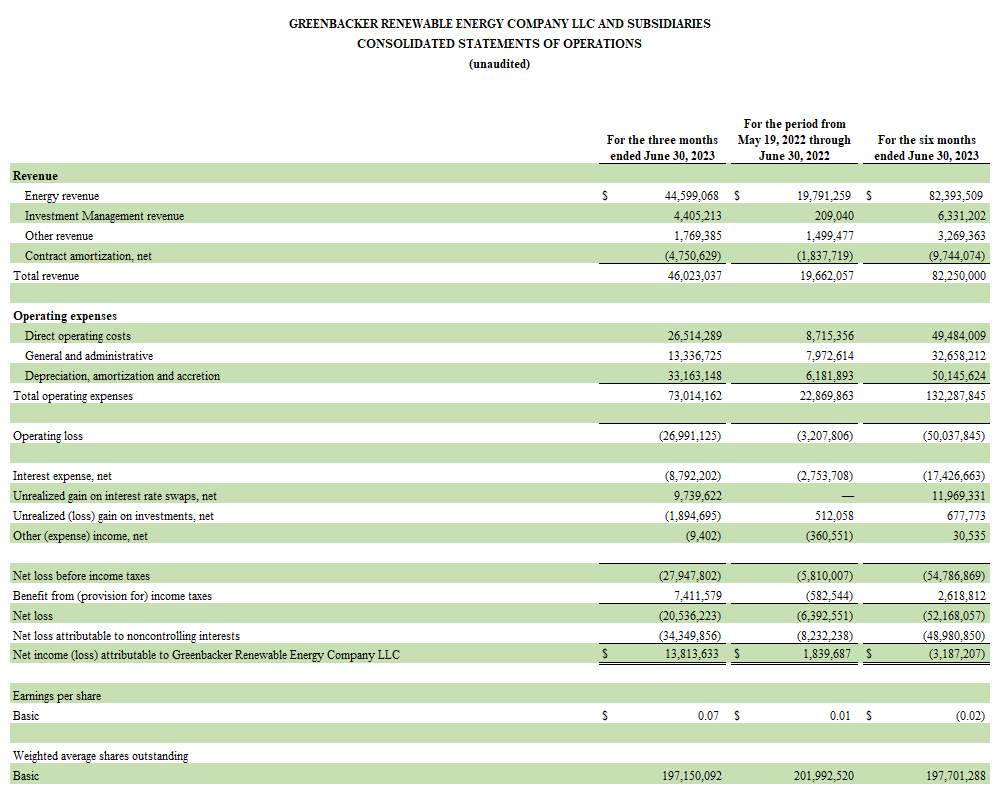
Over the period, Greenbacker generated total operating revenue of $50.8 million, primarily from energy revenue within the IPP segment. Energy revenue was $44.6 million and included $39.6 million from our long-term PPAs.
In terms of PPA revenue, the Company’s operating solar fleet, which included 309 operating assets comprising 979 MW of capacity, generated $24.1 million from nearly 484,000 MWh of production. GREC’s operating wind fleet, which included 16 operating projects comprising 386 MW of capacity, generated $14.1 million from 269,000 MWh of production.
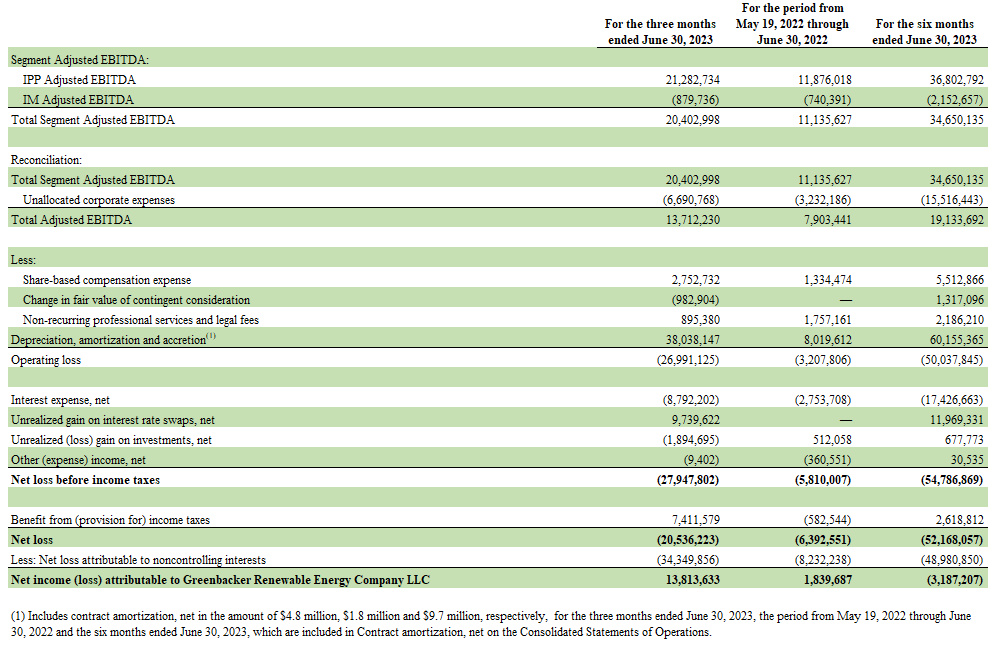
Adjusted EBITDA was $13.7 million for the quarter, largely driven by Adjusted EBITDA within the IPP segment of $21.2 million. Direct operating costs associated with capital raise efforts for certain of IM’s managed funds in their early stages and corporate expenses offset IPP results. The net income attributable to Greenbacker was approximately $13.8 million.
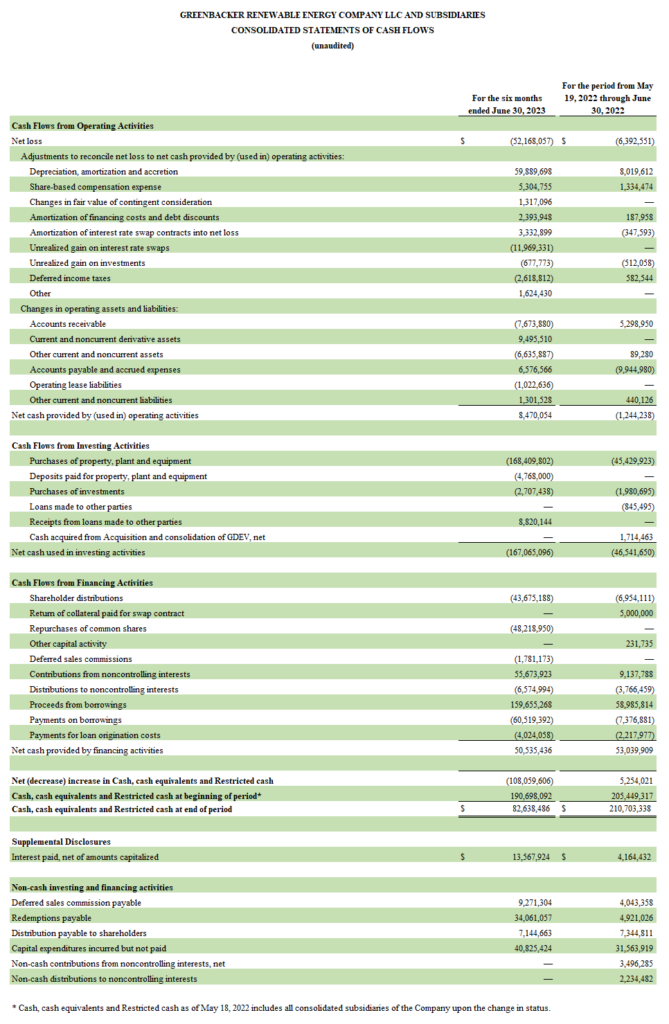
Funds From Operations (“FFO”) was $2.5 million for the period and represents the $13.7 million of Adjusted EBITDA less cash interest expense and distributions to our tax equity investors.
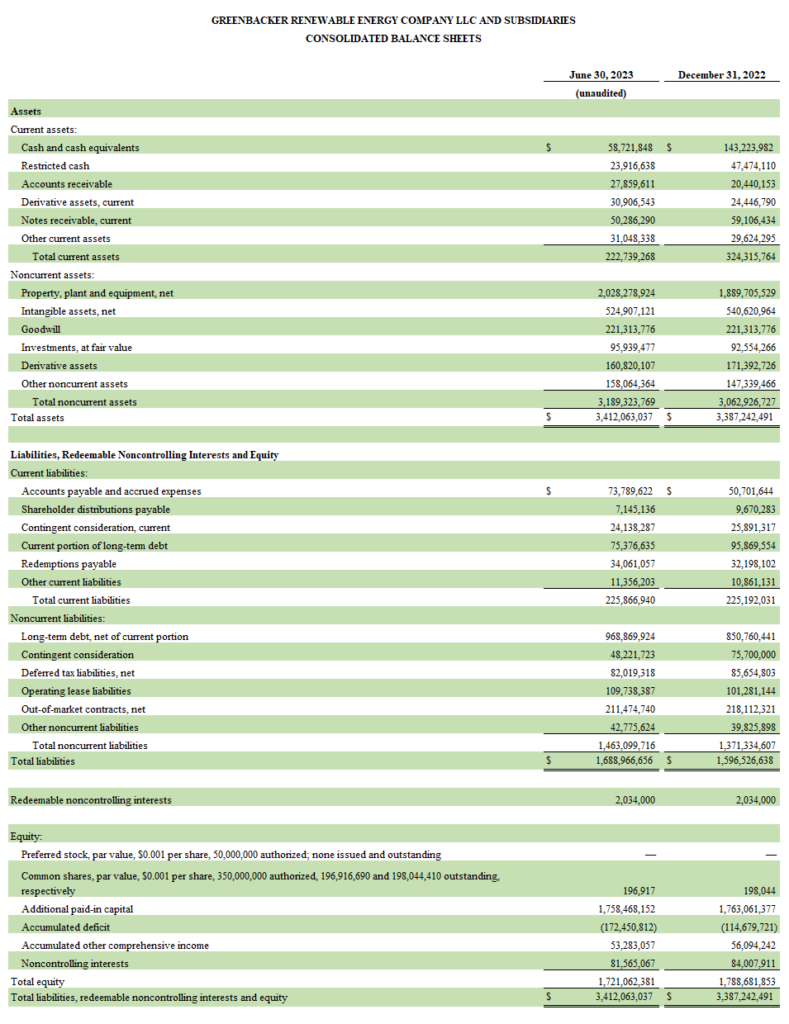
For the three months ended June 30, 2023In millions (unaudited)Select Financial Information Total Revenue$ 46.0Total operating revenue*$ 50.8Net income attributable to Greenbacker$ 13.8 Adjusted EBITDA†$ 13.7FFO†$ 2.5NOTE: See the Company’s second quarter 10-Q filed with the SEC for additional financial information and important related disclosures.
*Total operating revenue excludes non-cash contract amortization, net.
†See “Non-GAAP Financial Measures” for additional discussion.
Over $86 million capital raised in investment vehicles managed by GCM; AUM increased to approximately $3.3 billion
During the second quarter, Greenbacker’s IM business segment continued to raise substantial additional capital from retail and institutional investors. The IM segment raised $86.6 million of new equity capital, on which GCM is entitled to collect management fees, bringing AUM3 to nearly $3.3 billion at the end of the period.
As of June 30, 2023, GCM served as the investment manager to four climate-focused funds. After one of these funds (Greenbacker Renewable Energy Company II, LLC) reached the $150 million capital deployment milestone earlier in the year, management fees on that fund became payable to GCM.
Company’s investments support carbon abatement, water conservation, and green jobs
Greenbacker’s renewable energy and energy transition investment activities continued to deliver on ESG metrics. As of June 30, 2023, the Company’s clean energy assets had cumulatively produced nearly 7.5 million MWh of clean power since January 2016, abating over 5.3 million metric tons of carbon.4
The Company’s clean energy projects have saved more than 5.1 billion gallons of water,5 compared to the amount of water needed to produce the same amount of power by burning coal, and its business activities will sustain more than 6,000 green jobs.6
Additional information regarding the Company’s impact can also be found in Greenbacker’s most recent impact report.
Forward-Looking Statements
This press release contains forward-looking statements within the meaning of the federal securities laws. Forward-looking statements are not guarantees of future performance and involve known and unknown risks, uncertainties and other factors that may cause the actual results to differ materially from those anticipated at the time the forward-looking statements are made. Although Greenbacker believes the expectations reflected in such forward-looking statements are based upon reasonable assumptions, it can give no assurance that the expectations will be attained or that any deviation will not be material. Greenbacker undertakes no obligation to update any forward-looking statement contained herein to conform to actual results or changes in its expectations.
Non-GAAP Financial Measures
In addition to evaluating the Company’s performance on a U.S. GAAP basis, the Company now utilizes certain non-GAAP financial measures to analyze the operating performance of our segments as well as our consolidated business. Each of these measures should not be considered in isolation from or as superior to or as a substitute for other financial measures determined in accordance with U.S. GAAP, such as net income (loss) or operating income (loss). The Company uses these non-GAAP financial measures to supplement its U.S. GAAP results in order to provide a more complete understanding of the factors and trends affecting its operations.
Adjusted EBITDA
Adjusted EBITDA is a non-GAAP financial measure that the Company uses as a performance measure, as well as for internal planning purposes. We believe that Adjusted EBITDA is useful to management and investors in providing a measure of core financial performance adjusted to allow for comparisons of results of operations across reporting periods on a consistent basis, as it includes adjustments relating to items that are not indicative on the ongoing operating performance of the business.
Adjusted EBITDA is a performance measure used by management that is not calculated in accordance with U.S. GAAP. Adjusted EBITDA should not be considered in isolation from or as superior to or as a substitute for net income (loss), operating income (loss) or any other measure of financial performance calculated in accordance with U.S. GAAP. Additionally, our calculation of Adjusted EBITDA may not be comparable to similarly titled measures reported by other companies.
Funds From Operations
FFO is a non-GAAP financial measure that the Company uses as a performance measure to analyze net earnings from operations without the effects of certain non-recurring items that are not indicative of the ongoing operating performance of the business. FFO is calculated using Adjusted EBITDA less the impact of interest expense (excluding the non-cash component) and distributions to tax equity investors under the financing facilities associated with our IPP segment.
The Company believes that the analysis and presentation of FFO will enhance our investor’s understanding of the ongoing performance of our operating business. The Company will consider FFO, in addition to other GAAP and non-GAAP measures, in assessing operating performance and as a proxy for growth in distribution coverage over the long term.
FFO should not be considered in isolation from or as a superior to or as a substitute for net income (loss), operating income (loss) or any other measure of financial performance calculated in accordance with U.S. GAAP.
General Disclosure
This information has been prepared solely for informational purposes and is not an offer to buy or sell or a solicitation of an offer to buy or sell any security, or to participate in any trading or investment strategy. The information presented herein may involve Greenbacker’s views, estimates, assumptions, facts, and information from other sources that are believed to be accurate and reliable and are, as of the date this information is presented, subject to change without notice.
Non-GAAP Reconciliations
Adjusted EBITDA
The following table reconciles Net income (loss) attributable to Greenbacker Renewable Energy Company LLC to Adjusted EBITDA:
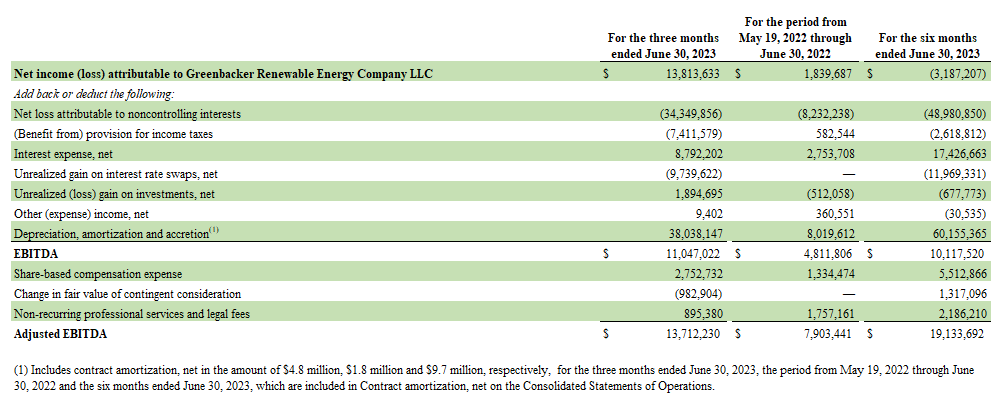
The Company defines Adjusted EBITDA as net income (loss) before: (i) interest expense; (ii) income taxes; (iii) depreciation expense; (iv) amortization expense (including contract amortization); (v) accretion; (vi) amounts attributable to our redeemable and non-redeemable noncontrolling interests; (vii) unrealized gains and losses on financial instruments; (viii) other income (loss); and (ix) foreign currency gain (loss). Additionally, the Company further adjusts for the following items described below:
- Share-based compensation is excluded from Adjusted EBITDA as it is different from other forms of compensation, as it is a non-cash expense and is highly variable. For example, a cash salary generally has a fixed and unvarying cash cost. In contrast, the expense associated with an equity-based award is generally unrelated to the amount of cash ultimately received by the employee, and the cost to the Company is based on a share-based compensation valuation methodology and underlying assumptions that may vary over time.
- The change in fair value of contingent consideration, which is related to Greenbacker’s acquisition of GCM and certain other affiliated companies, is excluded from Adjusted EBITDA, if any such change occurs during the period. The non-cash, mark-to-market adjustments are based on the expected achievement of revenue targets that are difficult to forecast and can be variable, making comparisons across historical and future quarters difficult to evaluate.
- Other costs that are not consistently occurring, not reflective of expected future operating expense, and provide no insight into the fundamentals of current or past operations of our business are excluded from Adjusted EBITDA. This includes costs such as professional services and legal fees.
The Company uses Segment Adjusted EBITDA to evaluate the financial performance of and allocate resources among our operating segments. Segment Adjusted EBITDA is determined for our segments consistent with the adjustments noted above but further excludes unallocated corporate expenses as these items are centrally controlled and are not directly attributable to any reportable segment.
The following table reconciles total Segment Adjusted EBITDA to Net income (loss) attributable to Greenbacker Renewable Energy Company LLC:
Funds From Operations
The following table reconciles Net income (loss) attributable to Greenbacker Renewable Energy Company LLC to Adjusted EBITDA and then to FFO:
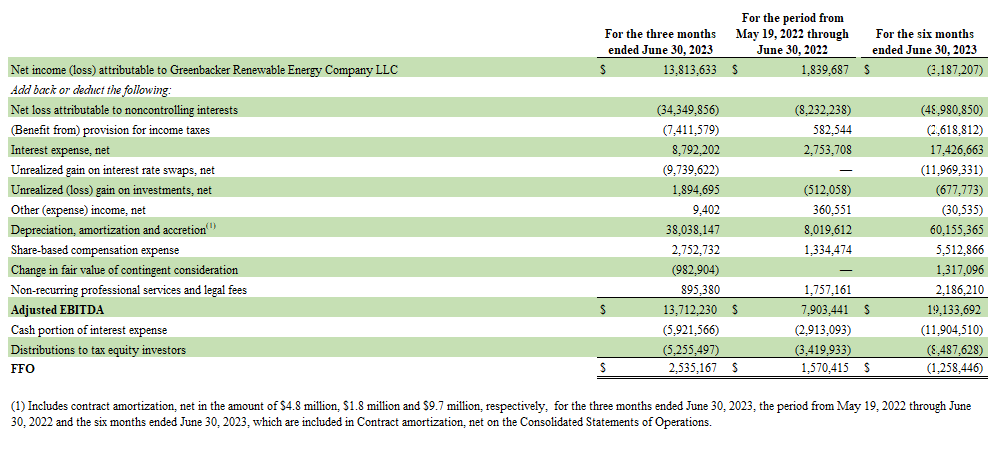
FFO is a non-GAAP financial measure that the Company uses as a performance measure to analyze net earnings from operations without the effects of certain non-recurring items that are not indicative of the ongoing performance of the business.
FFO is calculated using Adjusted EBITDA less the impact of interest expense (excluding the non-cash component) and distributions to tax equity investors under the financing facilities associated with our IPP segment.
1 Past performance is not indicative of future results.
2 Total assets and megawatts statistics include those projects where the Company has contracted for the acquisition of the project pursuant to a Membership Interest Purchase Agreement (“MIPA”).
3 Total AUM includes GREC and GCM’s managed funds. AUM represents the underlying fair value of investments, determined generally in accordance with ASC 820, cash and cash equivalents and project level debt. These figures are unaudited and subject to change.
4 When compared with a similar amount of power generation from fossil fuels. Carbon abatement is calculated using the EPA Greenhouse Gas Equivalencies Calculator which uses the Avoided Emissions and generation Tool (AVERT) US national weighted average CO2 marginal emission rate to convert reductions of kilowatt-hours into avoided units of carbon dioxide emissions.
5 Gallons of water saved are calculated based on Operational water consumption and withdrawal factors for electricity generating technologies: a review of existing literature – IOPscience, J Macknick et al 2012 Environ. Res. Lett. 7 045802.
6 Green jobs are calculated from the International Renewable Energy Agency's measurement that one megawatt of renewable power supports approximately 4 jobs. Data is as of June 30, 2023.