
GREC 2025 Annual Meeting of Shareholders
The GREC 2025 Annual Meeting of Shareholders originally scheduled for May 30, 2025 has been adjourned and rescheduled to July 31, 2025 at 1:00pm Eastern, to allow additional time for shareholders to submit their votes. You may vote your shares online, review the proxy material and/or register to attend the Meeting by visiting https://web.viewproxy.com/
Greenbacker Renewable Energy Company (GREC) is a publicly reporting, non-traded limited liability company that acquires and manages income-generating renewable energy and other energy-related businesses. Our business objective is to generate attractive risk-adjusted returns for our investors, consisting of both current income and long-term capital appreciation. We do this by acquiring and financing the construction and operation of income-generating renewable energy and sustainable development projects, primarily within North America. GREC invests in a diversified portfolio of income-producing renewable energy power facilities that sell long-term electricity contracts to off-takers with high credit quality, such as utilities, municipalities, and corporations.
By the numbers
Calendar Year Returns (2)
| Class P-I (3) | 5.52% | 6.60% | 8.84% | 6.89% | 10.07% | 4.10% | 6.71% | 0.15% | -1.88% | -34.97% |
| Class P-A (4,5) | 4.55% | 1.58% | 0.92% | 5.64% | 9.48% | 6.09% | 6.40% | 0.10% | -1.68% | -35.68% |
| Class P-D (6) | - | - | - | - | - | 3.94% | 6.20% | 0.13% | -1.73% | -34.92% |
| Class P-T (6) | - | - | - | - | - | 3.82% | 5.41% | -0.96% | -1.92% | -35.01% |
| Class P-S (6) | - | - | - | - | - | 3.98% | 6.13% | -0.82% | -2.18% | -35.77% |
Past performance is not indicative of future results. Return information is unaudited and subject to change. All returns shown assume reinvestment of distributions and are net of all expenses.
- Monthly Share Value (MSV) based calculations involve significant professional judgment. The calculated value of our assets and liabilities may differ from our actual realizable value or future value, which would affect the MSV as well as any returns derived from MSV, and ultimately the value of your investment. See the Private Placement Memorandum (“PPM”) for additional details related to the calculation of MSV. On February 4, 2025, GREC filed an 8-K with the SEC regarding an update to the Company's net asset value update process, upon which MSV is based. For more information, please view the 8-K filing.
- Returns shown reflect the percentage change in the MSV per share from the beginning of the applicable period, plus the amount of any distribution per share declared in the period. All returns are unaudited, assume the reinvestment of distributions, and are net of all expenses including G&A expenses, management fees, performance participation fees, and share class specific fees, as applicable.
- Class P-I shares launched in May 2016, no returns prior to launch.
- Class P-A shares launched in May 2016, no returns prior to launch.
- Class P-A shares were converted into Class P-I shares during the quarter ended June 30, 2017 and were not offered for sale for the period through April 15, 2018. Effective April 16, 2018, Class P-A shares were again offered.
- Class P-D, P-T, and P-S shares launched in February 2021, no returns prior to launch.
- 2025 YTD figures are representative of the period of January 1, 2025 through May 31, 2025.
Operational growth highlights
(Year-over-year)
AS OF 3/31/25
Operating fleet grew by 3%.
Total power production increased by 12%.
Converting pre-operating projects into assets generating revenue

Operating
53%
Pre-operating
24%
Under construction
23%

3.0 GW
total clean power generating and storage capacity
1.6 GW
total operating capacity

23%
of project fleet is in construction, expected to be built by 2027
Long-term contracted cash flows1

Investment-grade utility
80%
Investment-grade corporation
9%
Non-rated3
7%
Investment-grade municipality
5%

256
total unique offtakers contracted to purchase power from GREC

<10%
no single offtaker accounts for more than ~10% of our contracted revenue
17.3 years2
average remaining PPA term of total portfolio
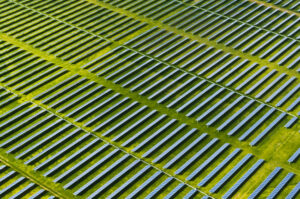
Capturing value across strategic areas of the country

Solar
73%
Wind
24%
Solar + Storage
2%
Battery Storage
1%
400+
renewable energy assets4 representing a total of 3.0 GW

Diversified
across solar, wind, and storage

35 States
provinces, territories, and Washington, D.C.
Diversification does not assure a profit or protect against loss in a declining market. Some figures may not add to stated totals due to rounding.
- References to cash flow reflect project-level cash flows and do not reflect investor-level cash flow or distributions. A portion of the portfolio of less than 1% includes offtakers that are categorized as non-investment grade and are not visually represented in the chart.
- Weighted average remaining contract term refers to the power purchase agreements (“PPA”) of our total assets.
- Non-rated off-takers are unrated by credit rating agencies.
- Prior to 3Q20 the Company did not formally track total asset and capacity statistics for projects the Company had contracted to acquire but had not yet closed.
TEAM

DAN DE BOER
INTERIM CHIEF EXECUTIVE OFFICER

ARMAND DEHANEY
PRINCIPAL, INVESTMENTS

MIKE DUDUM
VP, INVESTMENTS

JACQUELINE FEDIDA
VP, INVESTMENTS

DONAL MAHONEY
VP, INVESTMENTS

BAILEY PLUMMER
PRINCIPAL, INVESTMENTS

CARL WEATHERLEY-WHITE
INTERIM CFO | EXECUTIVE COMMITTEE
GREC Portfolio Activity
Greenbacker delivers first quarter results
Greenbacker Renewable Energy Company has announced results for the first quarter of 2025, including year-over-year increases in power purchase agreement (“PPA”) revenue, operating capacity, and clean power production, as the company placed over a dozen new solar assets into commercial operation. Highlights included $39 million PPA revenue, a 17% year-over-year increase, driven by a 14% increase in energy generation across Greenbacker’s combined wind and solar fleet. Company also shared additional detail regarding major construction on its largest asset to date: the 674 MW Cider solar project which, when completed in 2026, is expected to be the largest solar project in New York State.

Greenbacker announces update regarding the Annual Meeting of Shareholders scheduled for May 30, 2025
Notice is hereby given that the Greenbacker Renewable Energy Company LLC Annual Meeting of Shareholders originally scheduled for May 30, 2025, at 1:00 p.m. Eastern Time was adjourned due to lack of sufficient votes to reach quorum. The date of the Annual Meeting of Shareholders has been rescheduled to Thursday, July 31, 2025, at 1:00 p.m. Eastern Time, to allow additional time for shareholders to submit their votes.

Construction begins on New York’s largest solar energy project
Greenbacker today announced the start of major construction activities on its Cider Solar Farm in Genesee County, New York. Cider, which broke ground on early construction activities in late 2024, was the first renewable energy project of its kind to receive a siting permit from the state’s Office of Renewable Energy Siting and Transmission under Section 94-c rules. Upon completion in late 2026, Cider will be New York’s largest solar farm to date. Cider’s initial major construction phase will focus on substantive civil and mechanical activities, including placement of steel piling and racking for solar modules.

Greenbacker’s Cider solar project awarded North American Solar Deal of the Year
Greenbacker is proud to announce that its Cider solar project has been named the 2024 North American Solar Deal of the Year by Proximo. The award honors the multi-tranche financing package behind the project, which includes one of the market’s earliest tax credit transfer bridge loans, and underscores Greenbacker’s continued commitment to advancing the energy transition through strong industry partnerships and innovative financing packages. The nearly $1 billion project financing supports the construction and operation of the 674 MWdc utility-scale project—the largest solar project ever built in New York state and the largest clean energy asset in Greenbacker’s portfolio to date.
Investor Center
For account-related inquiries, contact our Transfer Agent at (833) 404-4104
For completed Greenbacker paperwork:
Regular Mail
PO Box 219255
Kansas City, MO 64121-9255
Overnight Mail
430 W 7th St Ste 219255
Kansas City, MO 64105-1407