Greenbacker delivers first quarter results
Company announces quarterly financial results and a 730 MW year-over-year increase in fleet capacity
Key Takeaways
- Fleet added nearly 730 MW of additional clean energy capacity and over 50 new assets.
- Company closed on largest solar-plus-storage project to date.
- Portfolio acquisition more than doubled solar fleet in Wisconsin, expanded solar footprint into Iowa.
- Operational fleet continued to expand, supporting significant production increase.
- Operating revenue of over $41 million in the quarter, driven by energy revenue.
- Over $58 million capital raised in investment vehicles managed by GCM; AUM increased to approximately $3.1 billion.
- Company’s investments abate carbon emissions, conserve water, and support green jobs.
New York, NY, May 16, 2023 — Greenbacker Renewable Energy Company LLC (“Greenbacker,” “GREC,” or the “Company”), an independent power producer and a leading climate-focused investment manager, has announced financial results1 for the first quarter of 2023, as well as substantial year-over-year expansion that included closing on its largest solar-plus-storage project to date.
Fleet added nearly 730 MW of additional clean energy capacity and over 50 new assets
Greenbacker’s clean energy fleet grew by 52 assets, on a year-over-year basis, increasing the Company’s total project count to 456 (including both operating and pre-operational assets).2
This expansion represented nearly 730 MW of additional total clean energy–generating and storage capacity across the country. As of March 31, 2023, Greenbacker was conducting business in 32 states, Canada, Puerto Rico, and Washington, DC.
Company closed on largest solar-plus-storage project to date
This growth encompassed another clean energy milestone for Greenbacker, which closed on the acquisition of its largest solar-plus-storage asset to date.
When completed, the pre-operational Lincoln Solar project, will have a solar energy–generating capacity of 80 MWac / 104 MWdc. Its battery storage system will have a total power capacity of 50 MW and be able to store up to 200 megawatt-hours (“MWh”) of clean energy onsite that it can deploy during times of peak demand or power outage, contributing to lower energy costs for consumers and improving grid resiliency.
With the project, located in Wyoming, Greenbacker continued to expand its clean energy presence in the Western region, as well as its co-located solar-plus-storage fleet—which now represents over 550 MWh of energy storage across the country.
Portfolio acquisition more than doubled solar fleet in Wisconsin, expanded solar footprint into Iowa
GREC continued to expand its solar footprint during the quarter, closing on nine assets in Wisconsin as part of a recently acquired 52 MW pre-operational portfolio with a project footprint spanning four states. These projects, which have all secured long-term PPAs, represent approximately 28 MW of clean-power production capacity, more than doubling the Company’s solar capacity in the state, which now tops 48 MW.
The portfolio also includes solar assets in Colorado and Maryland, boosting Greenbacker’s solar portfolio in the respective states to 118 MW and 40 MW, as well as the Company’s first solar project in Iowa: the 2 MW Maple City solar project.
Charles Wheeler, CEO of Greenbacker, said:
“Greenbacker continues to expand into new geographies and set new Company records, bringing more clean power to consumers, making further strides toward a clean energy future, and bringing additional attractive energy transition investment opportunities to market.”
Operational fleet continued to expand, supporting significant production increase
The power-production capacity of Greenbacker’s operating fleet of clean energy projects increased by 268 MW, representing year-over-year growth of 24%, as the Company moved under-construction projects into commercial operation and acquired new operational projects.
With this capacity growth, the Company’s fleet generated over 576,000 MWh of total clean power during the quarter, a 14% year-over-year increase that showcased continued production growth.
The table below summarizes the year-over-year expansion of Greenbacker’s portfolio.
GREC Portfolio Metrics*March 31, 2023March 31, 2022YoY Increase (total)YoY increase (%)Power-production capacity of operating fleet at end of period1.4 GW1.1 GW268 MW24%Power-generating capacity of pre-operational fleet at end of period2.0 GW1.5 GW461 MW30%Total power-generating capacity of fleet at end of period3.4 GW2.6 GW729 MW28%YTD total energy produced at end of period (MWh)576,355505,66770,68814%Total number of fleet assets at end of period4564045213%*Gigawatt (GW) figures rounded to nearest tenth of a GW.
Operating revenue of over $41 million in the quarter, driven by energy revenue
Greenbacker has also announced discrete first quarter financial information for its Independent Power Producer (“IPP”) and Investment Management (“IM”) business segments, the latter of which includes Greenbacker Capital Management (“GCM”) and its investment management platform.
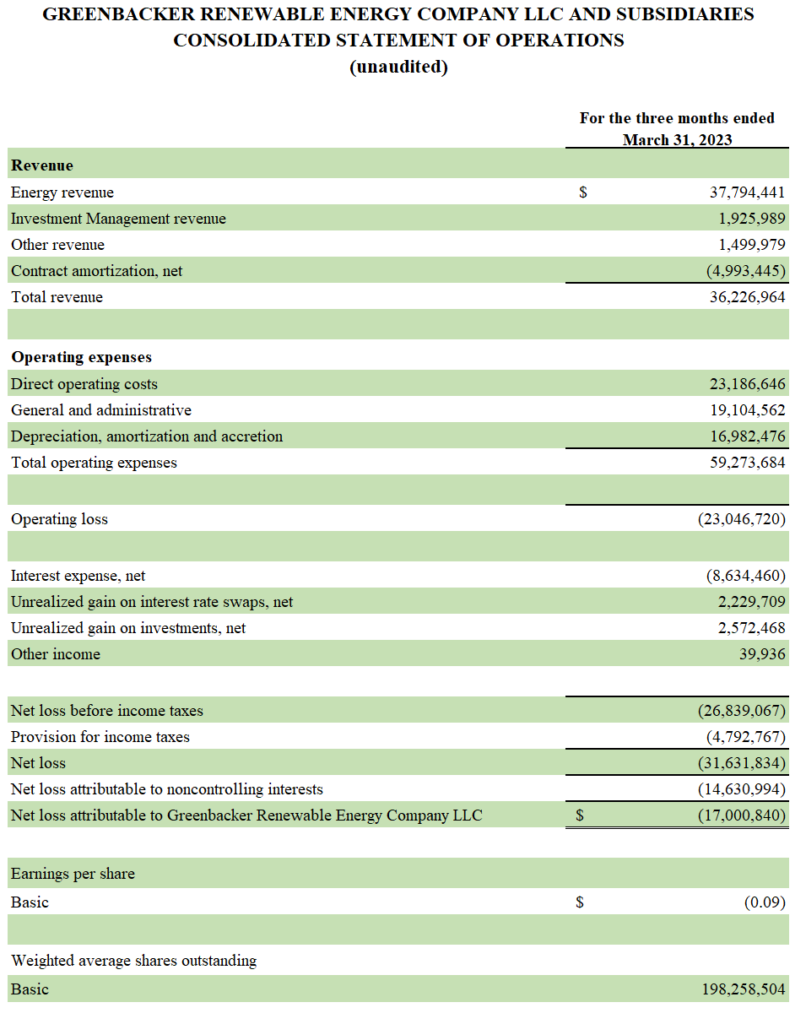
Over the period, Greenbacker generated total operating revenue of $41.2 million, primarily from energy revenue within the IPP segment. Energy revenue was $37.8 million and included $28.8 million from our long-term PPAs.
In terms of PPA revenue, the Company’s operating solar fleet, which included 298 operating assets comprising 958 MW of capacity, generated $12.8 million from over 255,000 MWh of production. GREC’s operating wind fleet, which included 16 operating projects comprising 386 MW of capacity, generated $16.2 million from more than 305,000 MWh of production.
Adjusted EBITDA was $5.4 million for the quarter, largely driven by Adjusted EBITDA within the IPP segment of $15.6 million. Direct operating costs associated with capital raise efforts for certain of IM’s managed funds in their early stages and corporate expenses offset IPP results. The net loss attributable to Greenbacker was approximately $17.0 million.
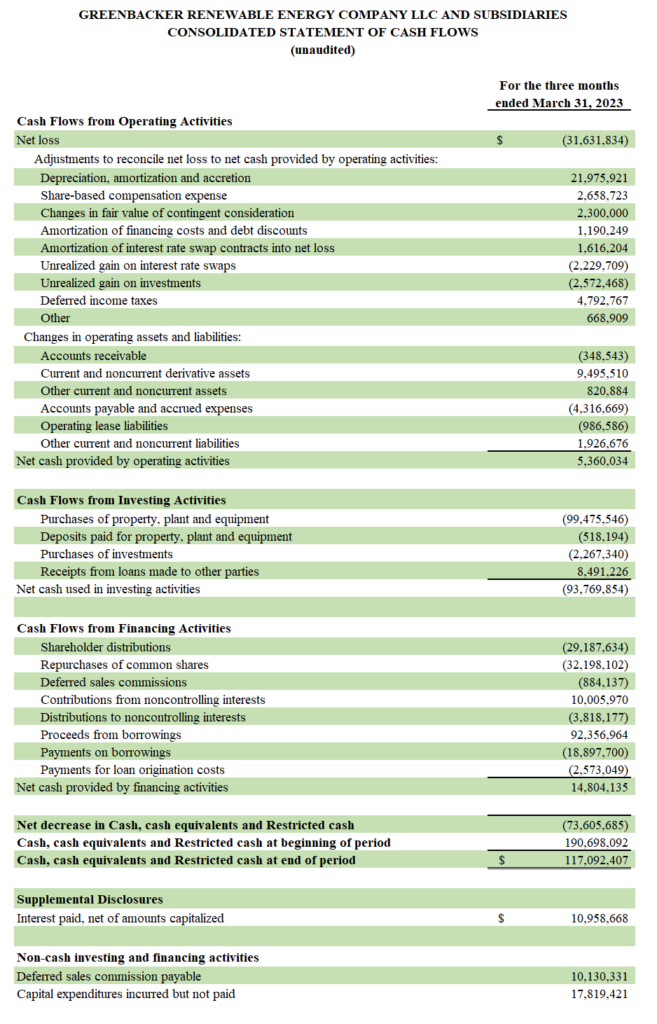
Funds From Operations (“FFO”) was $(3.8) million for the period and represents the $5.4 million of Adjusted EBITDA less cash interest expense and distributions to our tax equity investors.
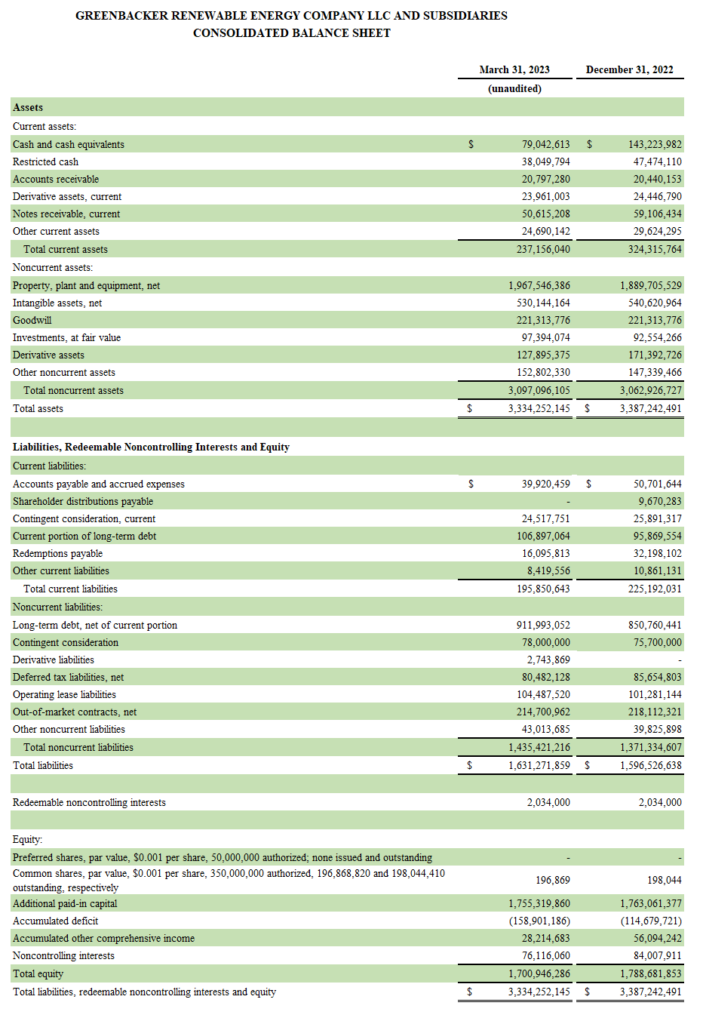
For the three months ended March 31, 2023In millions (unaudited)Select Financial Information Total Revenue$ 36.2Total operating revenue*$ 41.2Net loss attributable to Greenbacker$ (17.0) Adjusted EBITDA†$ 5.4FFO†$ (3.8)NOTE: See the Company’s first quarter 10-Q filed with the SEC for additional financial information and important related disclosures.
*Total operating revenue excludes non-cash contract amortization, net.
†See “Non-GAAP Financial Measures” for additional discussion.
Over $58 million capital raised in investment vehicles managed by GCM; AUM increased to approximately $3.1 billion
Greenbacker’s IM business segment continued to raise substantial additional capital from retail and institutional investors during the first quarter. The IM segment raised $58.1 million of new equity capital, on which GCM is entitled to collect management fees, bringing AUM3 to approximately $3.1 billion at the end of the period.
As of March 31, 2023, GCM served as the investment manager to four climate-focused funds. As a result of one of these funds (Greenbacker Renewable Energy Company II, LLC) reaching the $150 million capital deployment milestone during the first quarter, management fees on that fund are now payable to GCM.
Company’s investments abate carbon emissions, conserve water, and support green jobs
Greenbacker’s renewable energy and energy transition investment activities continued to deliver on ESG metrics. As of March 31, 2023, the Company’s clean energy assets had cumulatively produced over 6.7 million MWh of clean power since January 2016, abating nearly 4.8 million metric tons of carbon.4
The Company’s clean energy projects have saved nearly 4.5 billion gallons of water,5 compared to the amount of water needed to produce the same amount of power by burning coal, and its business activities will sustain more than 5,900 green jobs.6
David Sher, Director of Greenbacker, said:
“With the high quality of the cashflows generated by our investments—and the historic tailwinds our industry continues to experience—we believe Greenbacker remains well positioned to continue delivering ESG metrics, delivering value for our shareholders, and delivering on our mission to empower a sustainable world.”
Forward-Looking Statements
This press release contains forward-looking statements within the meaning of the federal securities laws. Forward-looking statements are not guarantees of future performance and involve known and unknown risks, uncertainties and other factors that may cause the actual results to differ materially from those anticipated at the time the forward-looking statements are made. Although Greenbacker believes the expectations reflected in such forward-looking statements are based upon reasonable assumptions, it can give no assurance that the expectations will be attained or that any deviation will not be material. Greenbacker undertakes no obligation to update any forward-looking statement contained herein to conform to actual results or changes in its expectations.
Non-GAAP Financial Measures
In addition to evaluating the Company’s performance on a U.S. GAAP basis, the Company now utilizes certain non-GAAP financial measures to analyze the operating performance of our segments as well as our consolidated business. Each of these measures should not be considered in isolation from or as superior to or as a substitute for other financial measures determined in accordance with U.S. GAAP, such as net income (loss) or operating income (loss). The Company uses these non-GAAP financial measures to supplement its U.S. GAAP results in order to provide a more complete understanding of the factors and trends affecting its operations.
Adjusted EBITDA
Adjusted EBITDA is a non-GAAP financial measure that the Company uses as a performance measure, as well as for internal planning purposes. We believe that Adjusted EBITDA is useful to management and investors in providing a measure of core financial performance adjusted to allow for comparisons of results of operations across reporting periods on a consistent basis, as it includes adjustments relating to items that are not indicative on the ongoing operating performance of the business.
Adjusted EBITDA is a performance measure used by management that is not calculated in accordance with U.S. GAAP. Adjusted EBITDA should not be considered in isolation from or as superior to or as a substitute for net income (loss), operating income (loss) or any other measure of financial performance calculated in accordance with U.S. GAAP. Additionally, our calculation of Adjusted EBITDA may not be comparable to similarly titled measures reported by other companies.
Funds From Operations
FFO is a non-GAAP financial measure that the Company uses as a performance measure to analyze net earnings from operations without the effects of certain non-recurring items that are not indicative of the ongoing operating performance of the business. FFO is calculated using Adjusted EBITDA less the impact of interest expense (excluding the non-cash component) and distributions to tax equity investors under the financing facilities associated with our IPP segment.
The Company believes that the analysis and presentation of FFO will enhance our investor’s understanding of the ongoing performance of our operating business. The Company will consider FFO, in addition to other GAAP and non-GAAP measures, in assessing operating performance and as a proxy for growth in distribution coverage over the long term.
FFO should not be considered in isolation from or as a superior to or as a substitute for net income (loss), operating income (loss) or any other measure of financial performance calculated in accordance with U.S. GAAP.
General Disclosure
This information has been prepared solely for informational purposes and is not an offer to buy or sell or a solicitation of an offer to buy or sell any security, or to participate in any trading or investment strategy. The information presented herein may involve Greenbacker’s views, estimates, assumptions, facts, and information from other sources that are believed to be accurate and reliable and are, as of the date this information is presented, subject to change without notice.
Non-GAAP Reconciliations
Adjusted EBITDA
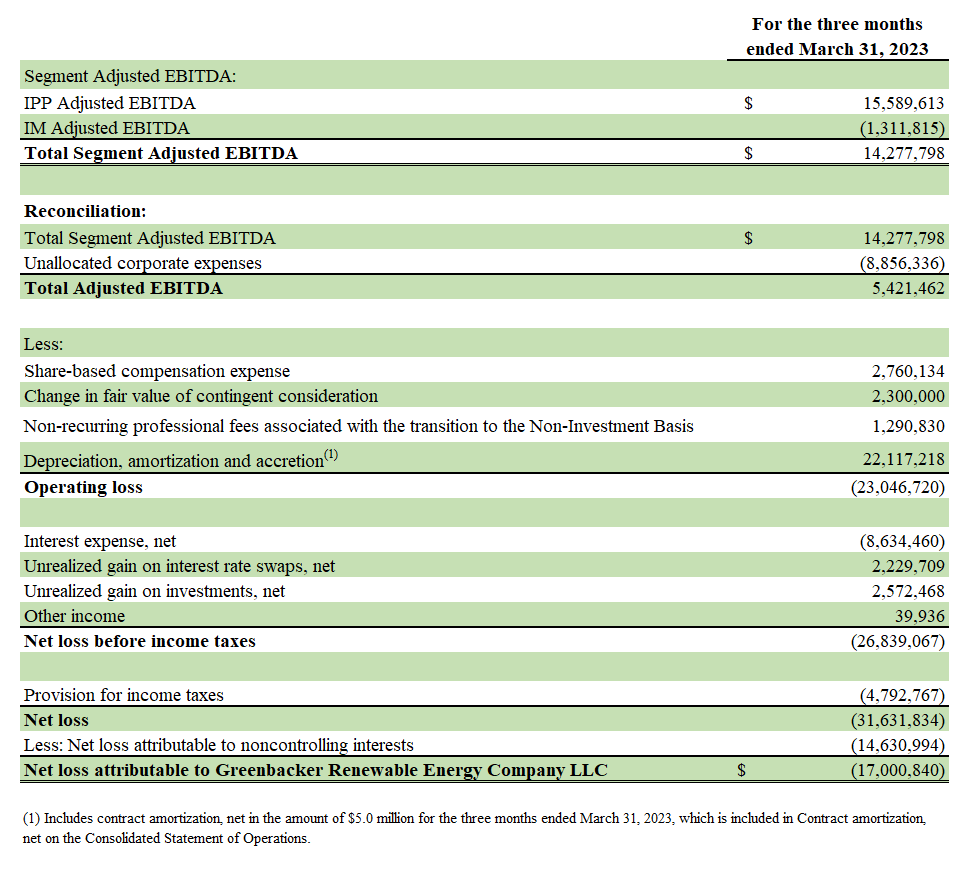
The following table reconciles Net loss attributable to Greenbacker Renewable Energy Company LLC to Adjusted EBITDA:
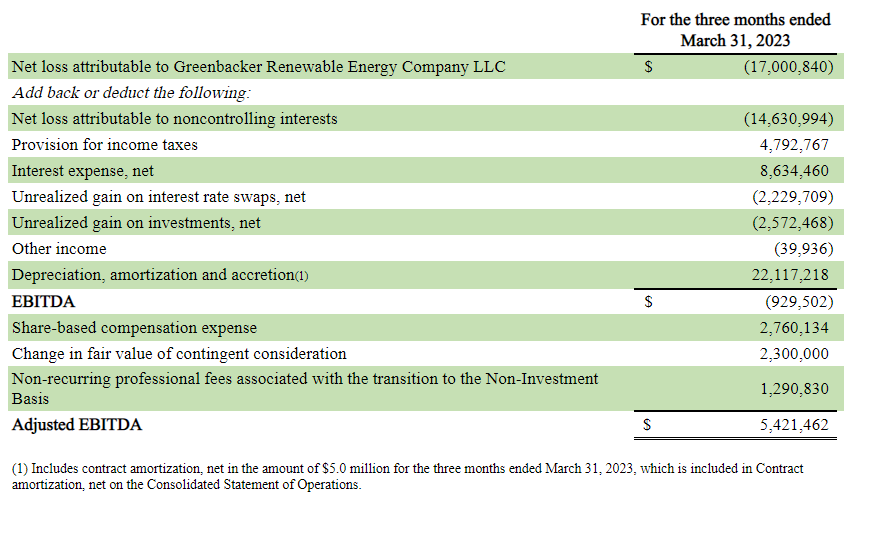
The Company defines Adjusted EBITDA as net income (loss) before: (i) interest expense; (ii) income taxes; (iii) depreciation expense; (iv) amortization expense (including contract amortization); (v) accretion; (vi) amounts attributable to our redeemable and non-redeemable noncontrolling interests; (vii) unrealized gains and losses on financial instruments; (viii) other income (loss); and (ix) foreign currency gain (loss). Additionally, the Company further adjusts for the following items described below:
- Share-based compensation is excluded from Adjusted EBITDA as it is different from other forms of compensation, as it is a non-cash expense and is highly variable. For example, a cash salary generally has a fixed and unvarying cash cost. In contrast, the expense associated with an equity-based award is generally unrelated to the amount of cash ultimately received by the employee, and the cost to the Company is based on a share-based compensation valuation methodology and underlying assumptions that may vary over time.
- The change in fair value of contingent consideration, which is related to Greenbacker’s acquisition of GCM and certain other affiliated companies, is excluded from Adjusted EBITDA, if any such change occurs during the period. The non-cash, mark-to-market adjustments are based on the expected achievement of revenue targets that are difficult to forecast and can be variable, making comparisons across historical and future quarters difficult to evaluate; and
- Other costs that are not consistently occurring, not reflective of expected future operating expense, and provide no insight into the fundamentals of current or past operations of our business are excluded from Adjusted EBITDA. This includes costs such as professional fees incurred as part of the transition to the Non-Investment Basis7 and other non-recurring costs unrelated to the ongoing operations of the Company.
The Company uses Segment Adjusted EBITDA to evaluate the financial performance of and allocate resources among our operating segments. Segment Adjusted EBITDA is determined for our segments consistent with the adjustments noted above but further excludes unallocated corporate expenses as these items are centrally controlled and are not directly attributable to any reportable segment.
The following table reconciles total Segment Adjusted EBITDA to Net loss attributable to Greenbacker Renewable Energy Company LLC:
Funds From Operations
The following table reconciles Net loss attributable to Greenbacker Renewable Energy Company LLC to Adjusted EBITDA and then to FFO:
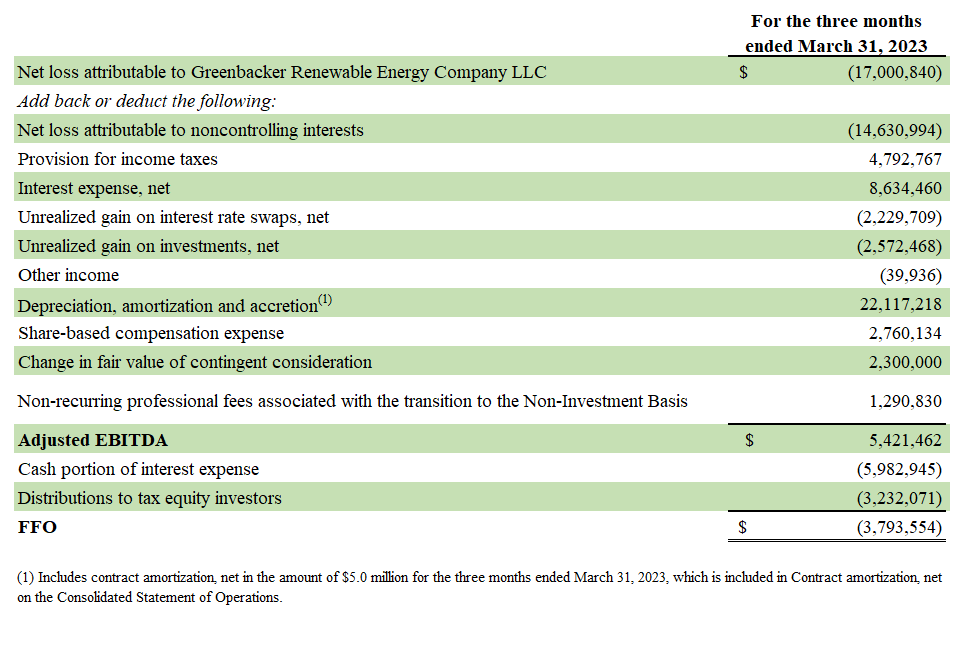
FFO is a non-GAAP financial measure that the Company uses as a performance measure to analyze net earnings from operations without the effects of certain non-recurring items that are not indicative of the ongoing performance of the business.
FFO is calculated using Adjusted EBITDA less the impact of interest expense (excluding the non-cash component) and distributions to tax equity investors under the financing facilities associated with our IPP segment.
1 Past performance is not indicative of future results.
2 Total assets and megawatts statistics include those projects where the Company has contracted for the acquisition of the project pursuant to a Membership Interest Purchase Agreement (“MIPA”).
3 Total AUM includes GREC and GCM’s managed funds. AUM represents the underlying fair value of investments, determined generally in accordance with ASC 820, cash and cash equivalents and project level debt. These figures are unaudited and subject to change.
4 When compared with a similar amount of power generation from fossil fuels. Carbon abatement is calculated using the EPA Greenhouse Gas Equivalencies Calculator which uses the Avoided Emissions and generation Tool (AVERT) US national weighted average CO2 marginal emission rate to convert reductions of kilowatt-hours into avoided units of carbon dioxide emissions.
5 Gallons of water saved are calculated based on Operational water consumption and withdrawal factors for electricity generating technologies: a review of existing literature – IOPscience, J Macknick et al 2012 Environ. Res. Lett. 7 045802.
6 Green jobs are calculated from the International Renewable Energy Agency's measurement that one megawatt of renewable power supports 4.6 jobs. Data is as of March 31, 2023.
7 We define "Non-Investment Basis" as "Non-investment company U.S. GAAP accounting the Company applied subsequent to the Acquisition" in the 10-Q.