Greenbacker delivers first quarter results
Company announces year-over-year increases in revenue, power production, and operating fleet capacity; completes $437 million financing; and expands leadership team
Key Takeaways
- Greenbacker converted 209 MW of pre-operating fleet into operational, revenue-generating assets, a year-over-year increase of 15%, boosting total operating capacity to 1.6 GW.
- Company plans to build out revenue-generating operating fleet, reaching 3.2 GW by end of 2027.
- $437 million financing completed; portfolio represents Greenbacker’s first major sale-leaseback financing and is among industry’s first deals to qualify for 40% tax credit via the IRA’s domestic content bonus.
- Total operating revenue topped $49 million, a year-over-year increase of 19%, driven by 21% increase in solar production and 6% increase in wind power generation.
- Raised $44 million in vehicles managed by Greenbacker Capital Management; fee-earning AUM ended period at approximately $0.7 billion, aggregate AUM at $3.7 billion.
- Company appointed new CFO and added newly created Head of Capital Markets position—following 2023’s Head of Infrastructure addition—roles integral to the firm’s future growth.
- Company’s investments abated carbon emissions, conserved water, and supported green jobs.
NEW YORK, NY, May 21, 2024 — Greenbacker Renewable Energy Company LLC (“Greenbacker,” “GREC,” or the “Company”), an independent power producer and a leading climate-focused investment manager, has announced financial results1 for the first quarter of 2024, including year-over-year increases in revenue, operating capacity,2 and clean energy generation.
Greenbacker converted 209 MW of pre-operational assets into revenue-generating, operational assets, a year-over-year increase of 15%
A key focus of Greenbacker’s recent new investment activity has been converting the pre-operational assets under the Company’s control to operational, revenue-generating assets, as well as the repowering of three operational wind projects.
The Company’s independent power producer (“IPP”) business segment placed into service 209 megawatts (“MW”) of clean energy-generating capacity, growing its operating fleet by 15% on a year-over-year basis. This expansion included bringing online the 99 MWdc / 80 MWac Fall River solar project—one of GREC’s largest assets to date.
As of March 31, 2024, GREC’s operating fleet had increased to 1,574 MW—nearly 1.6 gigawatts (“GW”)—of projects generating revenue through the sale of electricity.
$437 million financing for wind repower portfolio includes Greenbacker’s major first sale-leaseback financing and represents one of industry’s first deals to leverage domestic content adder
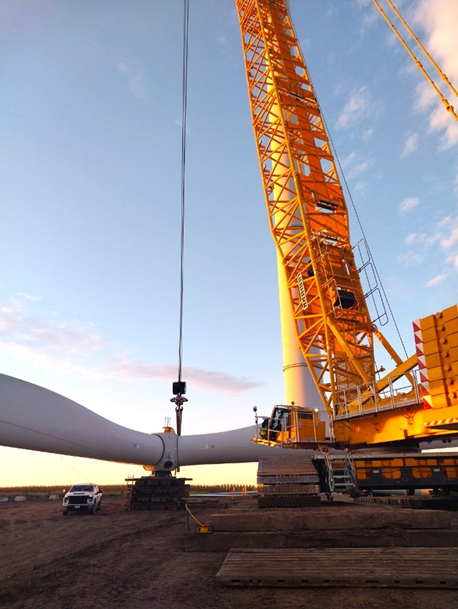
During the first quarter of 2024, Greenbacker completed construction and financing on the third and final wind asset in its first portfolio of repowers (after completing financing on the previous two repowers in late 2023), bringing total financing for the milestone portfolio to $437.2 million.
The portfolio represents a number of financing milestones for Greenbacker. The projects are among the clean energy industry’s first to utilize the 10% domestic content bonus newly created by the Inflation Reduction Act (“IRA”),3 in addition to qualifying for the 30% investment tax credit.
The repowers are also Greenbacker’s first sizable projects financed via sale-leaseback. This financing structure provided the Company with greater upfront proceeds and efficiently captured the benefits of both tax equity financing and back leverage lending in a single transaction.
By monetizing the portfolio’s 40% tax credit through the sale-leaseback financing, Greenbacker was able to realize the IRA’s benefits more quickly, both fully financing the repowers and utilizing additional proceeds for other corporate activity, such as converting the Company’s pre-operational pipeline into operational revenue-generating assets.
Greenbacker repowers 38 MW wind asset
Company’s first-quarter total operating revenue topped $49 million, a year-over-year increase of 19%, driven by growth in both solar and wind power generation
GREC’s fleet of clean energy projects produced over 644,000 megawatt-hours (“MWh”) of total power, representing a year-over-year increase of 12%.
The production increase was largely driven by a 21% increase from Greenbacker’s operating solar fleet, which generated approximately 308,000 MWh of clean power. Greenbacker’s wind fleet experienced a 6% year-over-year uptick in power generation, producing more than 325,000 MWh of energy.
The Company’s wind energy production increase was realized despite the third and final asset in the repower portfolio being offline for a portion of the first quarter of 2024 while its repowering was being concluded. With all work now completed, the repowered assets are projected to significantly increase Greenbacker’s annual operating revenue in the long term, starting by contributing over $24 million of revenue in 2024.4
GREC Operating Fleet*First Quarter 2024First Quarter 2023YoY Increase (total)YoY increase (%)Clean power produced by solar assets (MWh)307,829255,22552,60421%PPA revenue generated by solar assets (millions)$15.3$12.8$2.520%Clean power produced by wind assets (MWh)325,406305,62819,7786%PPA revenue generated by wind assets (millions)$17.7$16.2$1.59%Total clean power generated by wind and solar assets (MWh)633,235560,85372,38213%Total PPA operating revenue generated by wind and solar assets (millions)$33.0$29.0$4.014%*Some figures may not add to stated totals, due to rounding.
Over the quarter, Greenbacker generated total operating revenue of $49.2 million, a year-over-year increase of 19% that amounted to an additional $7.9 million of operating revenue.
This increase was primarily driven by energy revenue within the IPP segment, which totaled $44.6 million and included $34.3 million from the Company’s long-term PPAs. Funds From Operations (“FFO”) was $(2.4) million for the period and represents the $9.2 million of Adjusted EBITDA less cash interest expense and distributions to our tax equity investors. The net loss attributable to Greenbacker was $8.5 million for the quarter, driven by items such as depreciation, amortization, and impairment charges recorded during the period.
For the three months ended March 31, 2024In millions (unaudited)Select Financial Information Total Revenue$ 46.6Total operating revenue*$ 49.2Net loss attributable to Greenbacker$ (8.5) Adjusted EBITDA†$ 9.2FFO†$ (2.4)NOTE: See the Company’s quarterly 10-Q filed with the SEC for additional financial information and important related disclosures.
*Total operating revenue excludes non-cash contract amortization, net.
†See “Non-GAAP Financial Measures” for additional discussion. Adjusted EBITDA and FFO are unaudited.
Leadership team expanded as Company appointed new Chief Financial Officer and added newly created position Head of Capital Markets
In early 2024, Greenbacker announced the expansion of its leadership team. Christopher Smith, CFA joined the Company as Chief Financial Officer, bringing over 20 years of accounting and finance experience within the energy sector.
The Company also welcomed Carl Weatherley-White as Head of Capital Markets, following the late-2023 addition of Daniel De Boer as Head of Infrastructure. These newly created roles, essential to the firm’s continued growth, highlighted Greenbacker’s expanding strategy, capability, and commitment to investing in the energy transition.
“We’re excited to have the right team in place at the right time, and we look forward to capitalizing on the opportunities we see across the energy transition investment landscape,” said Charles Wheeler, CEO of GREC. “We remain focused on building value for our shareholders, while providing a differentiated and compelling value proposition through direct access to the investment opportunities arising from the massive capital need as the world transitions to a clean energy future.”
Over $44 million was raised in investment vehicles managed by GCM, increasing fee-earning AUM to approximately $728 million
Greenbacker Capital Management (“GCM”) raised $44.2 million for its managed funds during the first quarter, increasing fee-earning AUM5 to approximately $728 million, as of quarter end. Aggregate AUM,6 which includes the assets managed for Greenbacker Renewable Energy Company, for which GCM does not receive management fees, was approximately $3.7 billion.
Company plans to build out its revenue-generating operating fleet, topping 3.2 GW by end of 2027
Greenbacker plans to continue building out its pre-construction pipeline, converting development opportunities into risk mitigated pools of operational cash flows on a rolling basis in the coming years. By 2027, assuming the Company successfully carries out these construction plans, Greenbacker expects to double the capacity of its operating fleet, leading to strong growth in revenues, cashflows, and Adjusted EBITDA, as these additional assets become operational and begin producing and selling electricity.7
The table below illustrates Greenbacker’s estimated timeline for bringing into service its current pre-operational pipeline.
Operating Fleet (MW)Pre-Operating Fleet (MW)Total (MW)Q4 2024 1,756 1,489 3,245Q4 2025 1,952 1,292 3,245Q4 2026 2,723 521 3,245Q4 2027 3,171 74 3,245Capacity figures are rounded to nearest MW. Figures may not add to stated totals due to rounding. The figures in this table reflect the estimated timeline as of 3/31/24. Timelines may change or be adjusted based on market conditions.
Compared with the estimated timeline included in Greenbacker’s annual results press release, the table reflects an overall net decrease of approximately 39 MW in Greenbacker's fleet. These MW represent pre-operational assets for which development timelines and project dynamics evolved to no longer optimally align with the Company’s investment strategy, and their removal was negligible to GREC’s overall value.
Company’s investments continued to abate carbon emissions, conserve water, and support green jobs
Along with significant year-over-year revenue, production, and capacity increases, GREC also continued to deliver on its sustainability goals.
As of March 31, 2024, Greenbacker’s clean energy assets had cumulatively produced approximately 9.3 million MWh of clean power since January 2016, abating 6.6 million metric tons of carbon.8 The Company’s clean energy projects have saved nearly 6.4 billion gallons of water,9 compared to the amount of water needed to produce the same amount of power by burning coal. Greenbacker’s investment activities will sustain over 6,700 green jobs.10
Additional information regarding the Company’s impact can also be found in Greenbacker’s latest impact report.
Forward-Looking Statements
This press release contains forward-looking statements within the meaning of the federal securities laws. Forward-looking statements are not guarantees of future performance and involve known and unknown risks, uncertainties and other factors that may cause the actual results to differ materially from those anticipated at the time the forward-looking statements are made. Although Greenbacker believes the expectations reflected in such forward-looking statements are based upon reasonable assumptions, it can give no assurance that the expectations will be attained or that any deviation will not be material. Greenbacker undertakes no obligation to update any forward-looking statement contained herein to conform to actual results or changes in its expectations.
Non-GAAP Financial Measures
In addition to evaluating the Company’s performance on a U.S. GAAP basis, the Company now utilizes certain non-GAAP financial measures to analyze the operating performance of our segments as well as our consolidated business. Each of these measures should not be considered in isolation from or as superior to or as a substitute for other financial measures determined in accordance with U.S. GAAP, such as net income (loss) or operating income (loss). The Company uses these non-GAAP financial measures to supplement its U.S. GAAP results in order to provide a more complete understanding of the factors and trends affecting its operations.
Adjusted EBITDA
Adjusted EBITDA is a non-GAAP financial measure that the Company uses as a performance measure, as well as for internal planning purposes. We believe that Adjusted EBITDA is useful to management and investors in providing a measure of core financial performance adjusted to allow for comparisons of results of operations across reporting periods on a consistent basis, as it includes adjustments relating to items that are not indicative on the ongoing operating performance of the business.
Adjusted EBITDA is a performance measure used by management that is not calculated in accordance with U.S. GAAP. Adjusted EBITDA should not be considered in isolation from or as superior to or as a substitute for net income (loss), operating income (loss) or any other measure of financial performance calculated in accordance with U.S. GAAP. Additionally, our calculation of Adjusted EBITDA may not be comparable to similarly titled measures reported by other companies.
Funds From Operations
FFO is a non-GAAP financial measure that the Company uses as a performance measure to analyze net earnings from operations without the effects of certain non-recurring items that are not indicative of the ongoing operating performance of the business. FFO is calculated using Adjusted EBITDA less the impact of interest expense (excluding the non-cash component) and distributions to tax equity investors under the financing facilities associated with our IPP segment.
The Company believes that the analysis and presentation of FFO will enhance our investor’s understanding of the ongoing performance of our operating business. The Company considers FFO, in addition to other GAAP and non-GAAP measures, in assessing operating performance and as a proxy for growth in distribution coverage over the long term.
FFO should not be considered in isolation from or as a superior to or as a substitute for net income (loss), operating income (loss) or any other measure of financial performance calculated in accordance with U.S. GAAP.
General Disclosure
This information has been prepared solely for informational purposes and is not an offer to buy or sell or a solicitation of an offer to buy or sell any security, or to participate in any trading or investment strategy. The information presented herein may involve Greenbacker’s views, estimates, assumptions, facts, and information from other sources that are believed to be accurate and reliable and are, as of the date this information is presented, subject to change without notice.
Non-GAAP Reconciliations
Adjusted EBITDA and FFO
The following table reconciles Net loss attributable to Greenbacker Renewable Energy Company LLC to Adjusted EBITDA and FFO:
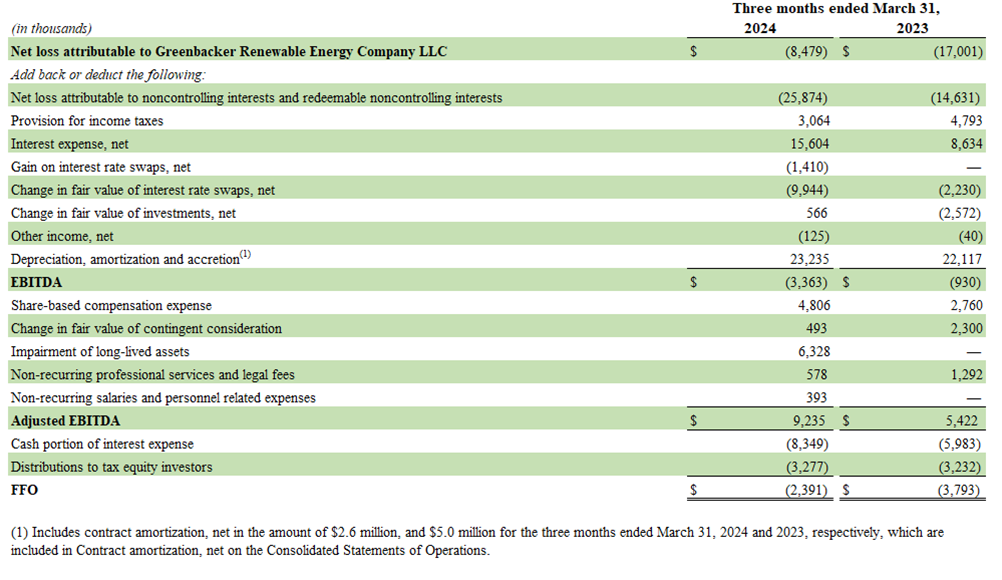
The Company defines Adjusted EBITDA as net income (loss) before: (i) interest expense; (ii) income taxes; (iii) depreciation expense; (iv) amortization expense (including contract amortization); (v) accretion; (vi) impairment of long-lived assets; (vii) amounts attributable to our redeemable and non-redeemable noncontrolling interests; (viii) unrealized gains and losses on financial instruments; (ix) other income (loss); and (x) foreign currency gain (loss). Additionally, the Company further adjusts for the following items described below:
- Share-based compensation is excluded from Adjusted EBITDA as it is different from other forms of compensation, as it is a non-cash expense and is highly variable. For example, a cash salary generally has a fixed and unvarying cash cost. In contrast, the expense associated with an equity-based award is generally unrelated to the amount of cash ultimately received by the employee, and the cost to the Company is based on a share-based compensation valuation methodology and underlying assumptions that may vary over time.
- The change in fair value of contingent consideration, which is related to Greenbacker’s acquisition of GCM and certain other affiliated companies, is excluded from Adjusted EBITDA, if any such change occurs during the period. The non-cash, mark-to-market adjustments are based on the expected achievement of revenue targets that are difficult to forecast and can be variable, making comparisons across historical and future quarters difficult to evaluate.
- Other costs that are not consistently occurring, not reflective of expected future operating expense, and provide no insight into the fundamentals of current or past operations of our business are excluded from Adjusted EBITDA. This includes costs such as professional services and legal fees, some of which were incurred as part of the transition to non-investment company accounting, and other non-recurring costs unrelated to the ongoing operations of the Company.
FFO is calculated using Adjusted EBITDA less the impact of interest expense (excluding the non-cash component) and distributions to tax equity investors under the financing facilities associated with our IPP segment.
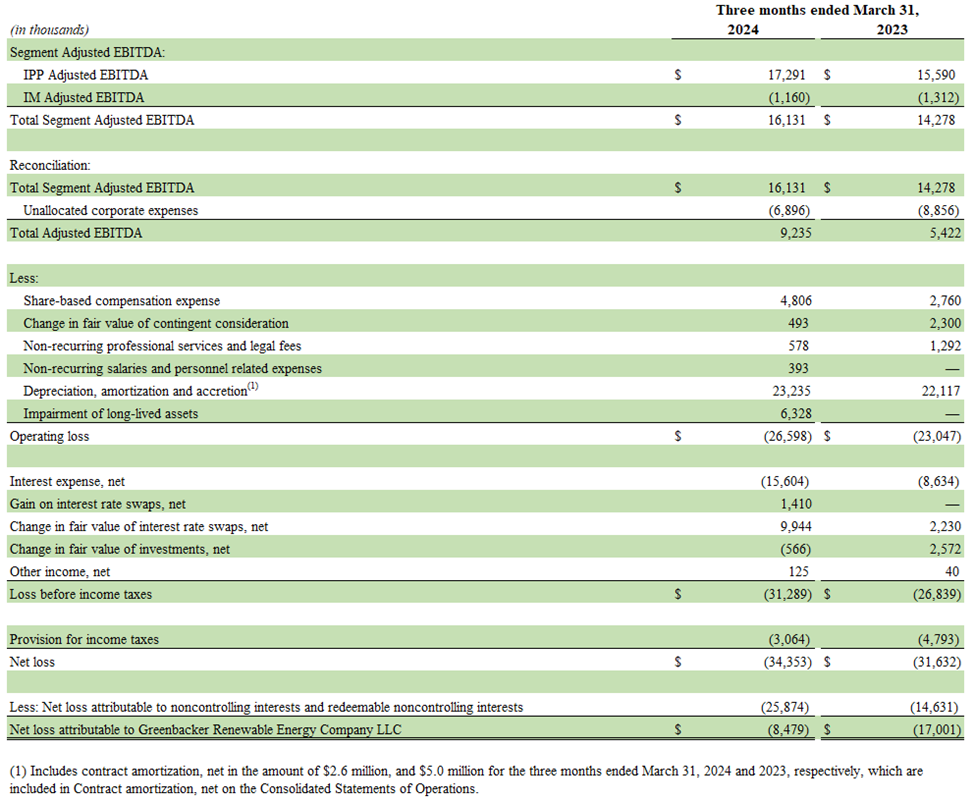
The Company uses Segment Adjusted EBITDA to evaluate the financial performance of and allocate resources among our operating segments. Segment Adjusted EBITDA is determined for our segments consistent with the adjustments noted above but further excludes unallocated corporate expenses as these items are centrally controlled and are not directly attributable to any reportable segment.
The following table reconciles total Segment Adjusted EBITDA to Net loss attributable to Greenbacker Renewable Energy Company LLC:
About Greenbacker Renewable Energy Company
Greenbacker Renewable Energy Company LLC is a publicly reporting, non-traded limited liability sustainable infrastructure company that both acquires and manages income-producing renewable energy and other energy-related businesses, including solar and wind farms, and provides investment management services to other renewable energy investment vehicles. We seek to acquire and operate high-quality projects that sell clean power under long-term contracts to high-creditworthy counterparties such as utilities, municipalities, and corporations. We are long-term owner-operators, who strive to be good stewards of the land and responsible members of the communities in which we operate. Greenbacker conducts its investment management business through its wholly owned subsidiary, Greenbacker Capital Management, LLC, an SEC-registered investment adviser. We believe our focus on power production and asset management creates value that we can then pass on to our shareholders—while facilitating the transition toward a clean energy future. For more information, please visit https://greenbackercapital.com.
1 Past performance is not indicative of future results.
2 Total assets and megawatts statistics include those projects where we have contracted for the acquisition of the project pursuant to a Membership Interest Purchase Agreement (“MIPA”). The financial and portfolio metrics set forth herein are unaudited and subject to change. Data as of March 31, 2024.
3 SB Energy secures $2.4 billion for incentive-rich utility-scale solar projects, PV Magazine, Ryan Kennedy, November 30, 2023.
4 Represents forward looking guidance. Please see our forward-looking statement disclosure at the end of this press release.
5 Fee-earning AUM represents the asset base upon which management fee revenue is earned from GCM's managed funds.
6 Aggregate AUM includes GREC and GCM’s managed funds. AUM represents the underlying fair value of investments, determined generally in accordance with ASC 820, cash and cash equivalents and project level debt. These figures are unaudited and subject to change.
7 Represents forward looking guidance. Please see our forward-looking statement disclosure at the end of this press release, as well as Greenbacker's recent SEC filings and shareholder communication for more information regarding Key Factors Impacting Our Operating Results and Financial Condition, which include a number of factors that present significant opportunities for Greenbacker but also pose risks and challenges.
8 When compared with a similar amount of power generation from fossil fuels. Carbon abatement is calculated using the EPA Greenhouse Gas Equivalencies Calculator which uses the Avoided Emissions and generation Tool (AVERT) US national weighted average CO2 marginal emission rate to convert reductions of kilowatt-hours into avoided units of carbon dioxide emissions. Data is as of March 31, 2024.
9 Gallons of water saved are calculated based on Operational water consumption and withdrawal factors for electricity generating technologies: a review of existing literature – IOPscience, J Macknick et al 2012 Environ. Res. Lett. 7 045802. Data is as of March 31, 2024.
10 Green jobs are calculated from the International Renewable Energy Agency's measurement that one megawatt of renewable power supports approximately four jobs. Data is as of March 31, 2024.